


1/ New 52-Weeks Highs
2/ Defense Joins the Party
3/ Looking for Breakout
4/ Losing Strength
Investopedia is partnering with CMT Association on this newsletter. The contents of this newsletter are for informational and educational purposes only, however, and do not constitute investing advice. The guest authors, which may sell research to investors, and may trade or hold positions in securities mentioned herein do not represent the views of CMT Association or Investopedia. Please consult a financial advisor for investment recommendations and services.
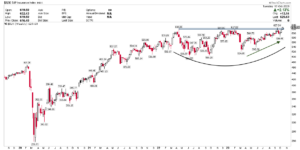
1/ Follow the Spread
The S&P 500 index for insurance companies has achieved a new all-time high and is poised to surpass a base that has been established for almost two years. The price has broken through the resistance zone on its fifth attempt and is poised to sustain the trend it has followed since the first quarter of the year.

As long as we are above the 629 level, the path of least resistance is higher.
2/ Defense Joins the Party
The defense industry has recently broken out of a two-year sideways trading range.
It experienced two false breakouts before finally surging above the resistance level. The primary bullish confirmation came from a hammer candle at the previous resistance level, which was further validated by a strong bullish candle yesterday.
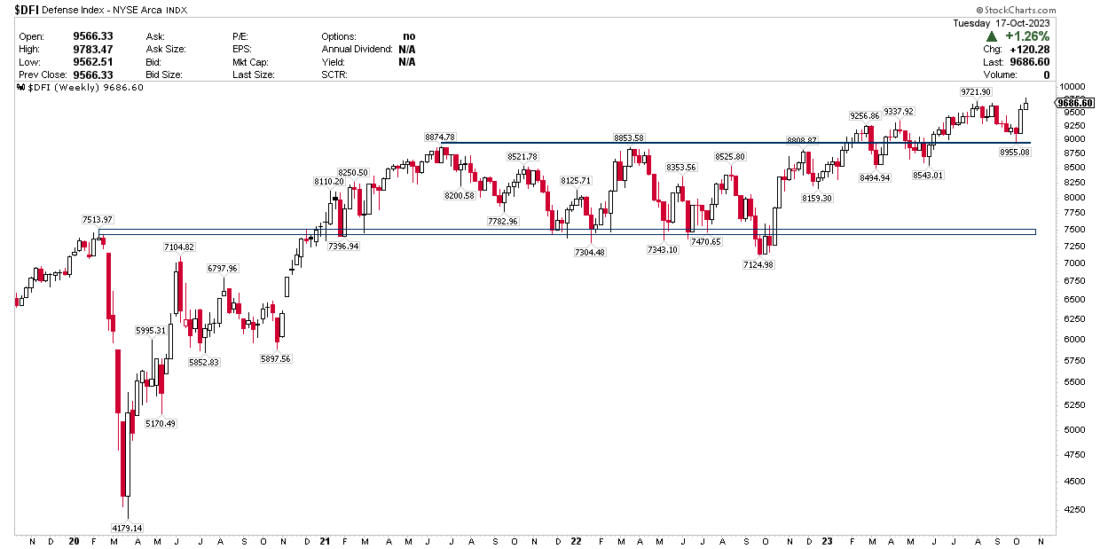
What’s next? The price must firmly stay above this level to sustain the uptrend and aim for higher levels.
3/ Looking for Breakout
Fair Isaac & Co., Inc. (FICO) rises by +3.57%, setting a new all-time high and breaking above the previous resistance zone.
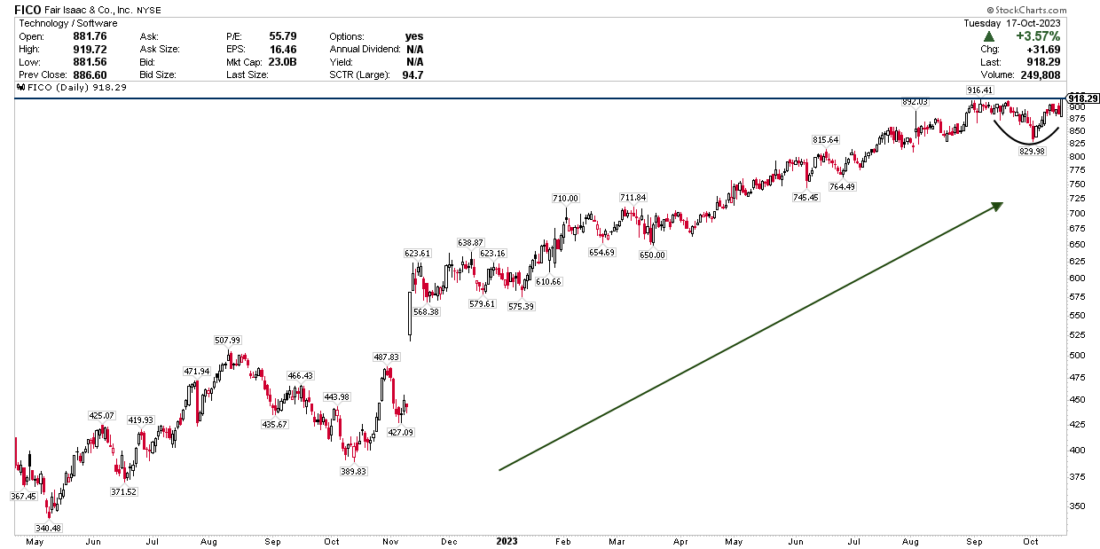
FICO exhibits signs of leadership in an industry that has yet to surpass resistance levels but remains bullish. The price is starting to break the consolidation pattern that followed the establishment of the previous high, indicating a desire to maintain the upward trend that has persisted since 2022.
4/ Losing Strength
The WTI (West Texas Intermediate) crude oil price has been oscillating sideways, hovering around $85.
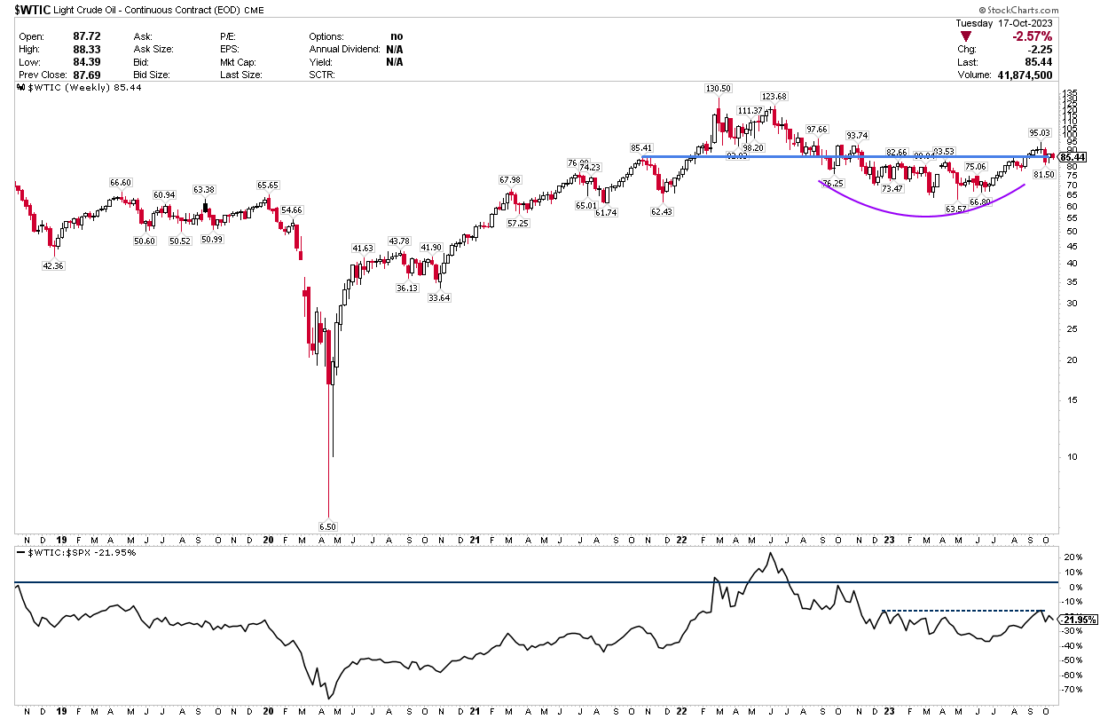
The relative strength ratio compared to the S&P 500 reveals a series of lower highs, indicating a weakening position compared to the equity market. It seems that crude oil may be waiting for developments related to the dollar and the geopolitical conflict in the middle east, which could lead to price increases if the conflict escalates or expands in scope. If the price were to drop below the $85 level, there is a high likelihood that it could decline to approximately $70. Conversely, if it manages to hold $85, it must harness this momentum to avoid losing steam and, ultimately, risking a decline.
—
Originally posted 18th October 2023
Disclosure: Investopedia
Investopedia.com: The comments, opinions and analyses expressed herein are for informational purposes only and should not be considered individual investment advice or recommendations to invest in any security or to adopt any investment strategy. While we believe the information provided herein is reliable, we do not warrant its accuracy or completeness. The views and strategies described on our content may not be suitable for all investors. Because market and economic conditions are subject to rapid change, all comments, opinions and analyses contained within our content are rendered as of the date of the posting and may change without notice. The material is not intended as a complete analysis of every material fact regarding any country, region, market, industry, investment or strategy. This information is intended for US residents only.
Disclosure: Interactive Brokers
Information posted on IBKR Campus that is provided by third-parties does NOT constitute a recommendation that you should contract for the services of that third party. Third-party participants who contribute to IBKR Campus are independent of Interactive Brokers and Interactive Brokers does not make any representations or warranties concerning the services offered, their past or future performance, or the accuracy of the information provided by the third party. Past performance is no guarantee of future results.
This material is from Investopedia and is being posted with its permission. The views expressed in this material are solely those of the author and/or Investopedia and Interactive Brokers is not endorsing or recommending any investment or trading discussed in the material. This material is not and should not be construed as an offer to buy or sell any security. It should not be construed as research or investment advice or a recommendation to buy, sell or hold any security or commodity. This material does not and is not intended to take into account the particular financial conditions, investment objectives or requirements of individual customers. Before acting on this material, you should consider whether it is suitable for your particular circumstances and, as necessary, seek professional advice.
Disclosure: Futures Trading
Futures are not suitable for all investors. The amount you may lose may be greater than your initial investment. Before trading futures, please read the CFTC Risk Disclosure. A copy and additional information are available at ibkr.com.


Join The Conversation
If you have a general question, it may already be covered in our FAQs. If you have an account-specific question or concern, please reach out to Client Services.