


By J.C. Parets & All Star Charts
1/ Pot Stocks Burn Shorts
2/ Big Tech vs. Everything Else
3/ Can Buyers Crack Supply?
4/ The 5-Year T-Note Lays Low
Investopedia is partnering with All Star Charts on this newsletter, which both sells its research to investors, and may trade or hold positions in securities mentioned herein. The contents of this newsletter are for informational and educational purposes only, however, and do not constitute investing advice.
1/ Pot Stocks Burn Shorts
With two straight days of massive gains, cannabis stocks are on pace to book one of their best weekly performances of all time. Pot stock bulls would tell you that the space was long overdue for a move higher, but the chart has been trending steadily lower for two and a half years now.
As regulators contemplate rescheduling marijuana away from a substance that is deemed to have “no medical use,” investors are cheering the news in anticipation of heightened demand for the entire industry.
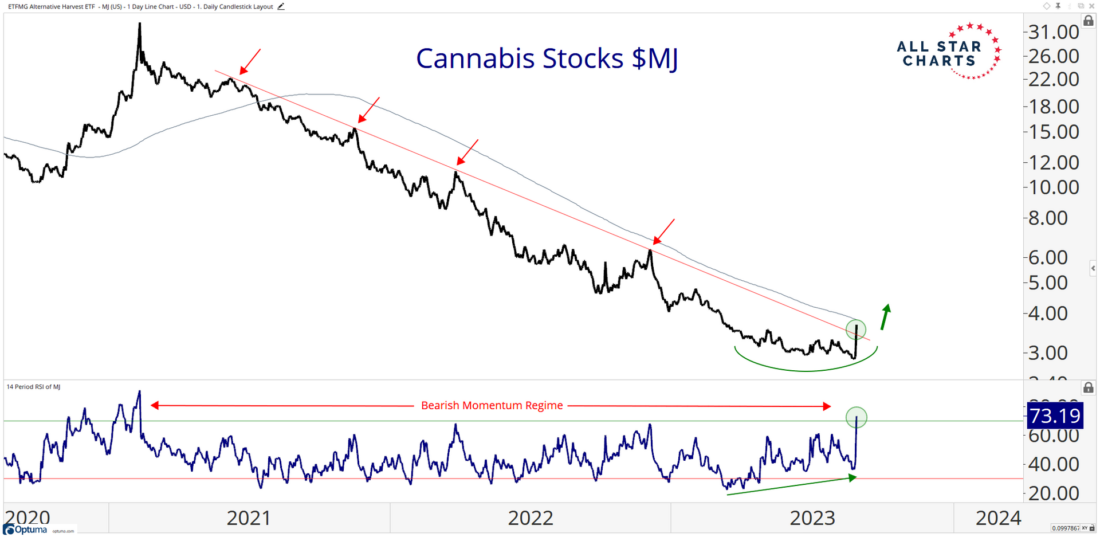
We’ve seen headlines drive prices higher for cannabis stocks many times over the past few years, but these news and events have never triggered any real follow-through. Today and yesterday already feel a little different, as we can point to technical developments on the chart that suggest this could be the start of a true trend reversal.
The first characteristic of a potential trend reversal is the trendline break. You can’t reverse course without it. Today, the ETFMG Alternative Harvest ETF (MJ) surged above its downtrend line from the 2021 highs. Momentum also triggered an overbought reading for the first time since Q1 2021. This all speaks to a change in character for cannabis stocks.
2/ Big Tech vs. Everything Else
Tech and growth stocks are not only hitting overhead supply in absolute terms, but the relative trends also suggest that their recent outperformance might pause for a while.
Below is the Nasdaq 100 (QQQ) relative to the Russell 3000 (IWV):
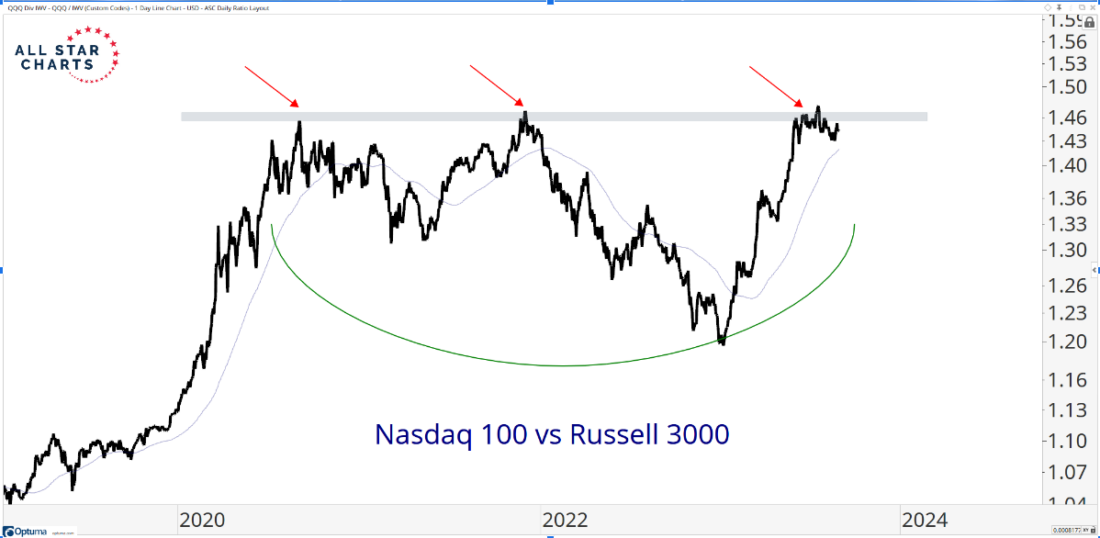
As you can see, this ratio is pressing against a shelf of former highs. Buyers are working on absorbing all the overhead supply at this critical resistance level. If and when they do, tech stocks will likely kick off the next leg higher on absolute terms, too.
3/ Can Buyers Crack Supply?
Commodities are chipping away at overhead supply. And no chart captures the growing demand for raw materials quite like crude oil.
Check out crude oil futures forming a multi-month base below a critical resistance level:
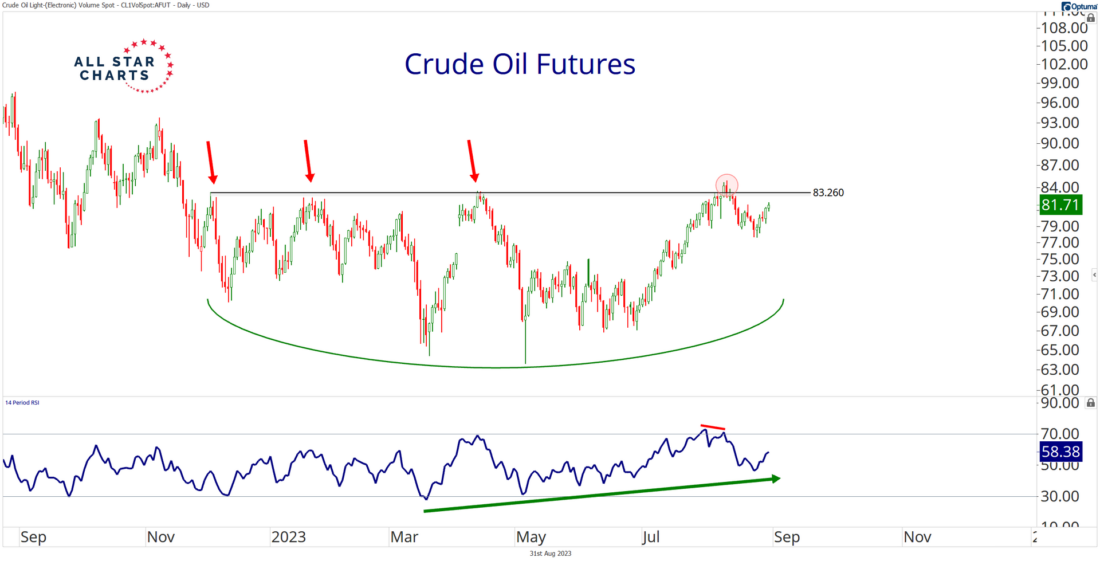
Buyers have challenged this supply zone four times since last November, with a failed breakout marking the most recent attempt.
Interestingly, bullish momentum continues to improve following a recent overbought reading.
We imagine that interest rates and inflation could be on the rise if and when buyers decisively crack crude oil’s resistance. This would likely lead to more breakouts across the commodity space and renewed woes for bonds.
4/ The 5-Year T-Note Lays Low
Crude oil prices at $100?
Perhaps. But falling bond prices would likely accompany a rally in black gold.
Notice that 5-year Treasury note futures construct a mirror image of the crude oil chart:
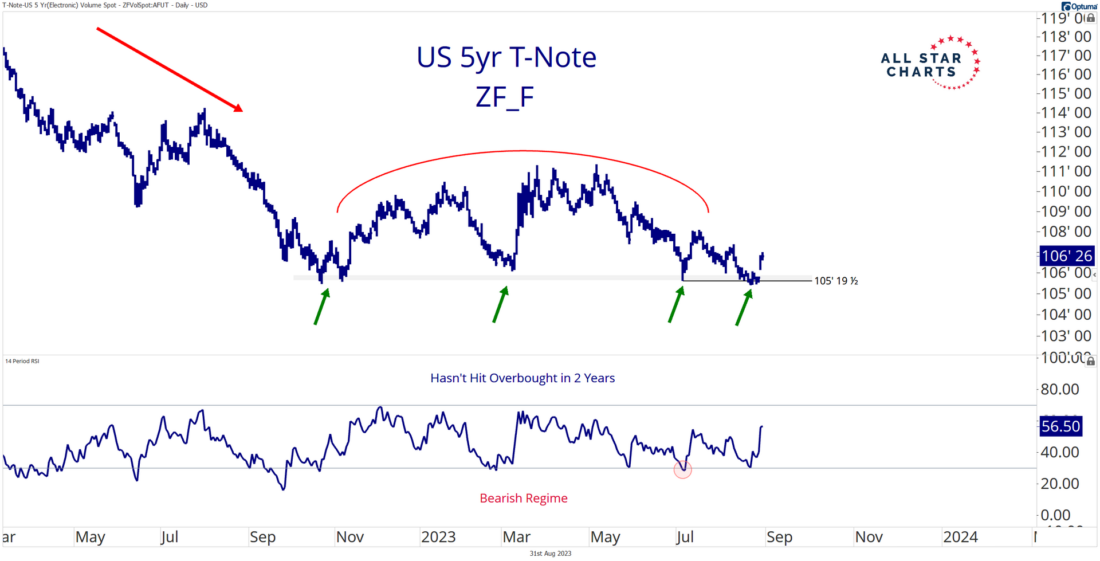
Multiple attempts to absorb supply in crude coincided with multiple attempts to overwhelm demand in the 5-year T-note.
Who’s got it right?
It’s tough to say, but we doubt that these two markets will resolve in the same direction.
U.S. Treasuries appear increasingly vulnerable—regardless of the intermarket landscape. While the 14-day relative strength index (RSI) reached its highest level in almost six months, the 5-year can’t seem to get off the mat.
—
Originally posted 31st August 2023
Disclosure: Investopedia
Investopedia.com: The comments, opinions and analyses expressed herein are for informational purposes only and should not be considered individual investment advice or recommendations to invest in any security or to adopt any investment strategy. While we believe the information provided herein is reliable, we do not warrant its accuracy or completeness. The views and strategies described on our content may not be suitable for all investors. Because market and economic conditions are subject to rapid change, all comments, opinions and analyses contained within our content are rendered as of the date of the posting and may change without notice. The material is not intended as a complete analysis of every material fact regarding any country, region, market, industry, investment or strategy. This information is intended for US residents only.
Disclosure: Interactive Brokers
Information posted on IBKR Campus that is provided by third-parties does NOT constitute a recommendation that you should contract for the services of that third party. Third-party participants who contribute to IBKR Campus are independent of Interactive Brokers and Interactive Brokers does not make any representations or warranties concerning the services offered, their past or future performance, or the accuracy of the information provided by the third party. Past performance is no guarantee of future results.
This material is from Investopedia and is being posted with its permission. The views expressed in this material are solely those of the author and/or Investopedia and Interactive Brokers is not endorsing or recommending any investment or trading discussed in the material. This material is not and should not be construed as an offer to buy or sell any security. It should not be construed as research or investment advice or a recommendation to buy, sell or hold any security or commodity. This material does not and is not intended to take into account the particular financial conditions, investment objectives or requirements of individual customers. Before acting on this material, you should consider whether it is suitable for your particular circumstances and, as necessary, seek professional advice.
Disclosure: ETFs
Any discussion or mention of an ETF is not to be construed as recommendation, promotion or solicitation. All investors should review and consider associated investment risks, charges and expenses of the investment company or fund prior to investing. Before acting on this material, you should consider whether it is suitable for your particular circumstances and, as necessary, seek professional advice.
Disclosure: Futures Trading
Futures are not suitable for all investors. The amount you may lose may be greater than your initial investment. Before trading futures, please read the CFTC Risk Disclosure. A copy and additional information are available at ibkr.com.


Join The Conversation
If you have a general question, it may already be covered in our FAQs. If you have an account-specific question or concern, please reach out to Client Services.