


1/ Fed Funds, the S&P, and Inflation Pt 1
2/ Fed Funds, the S&P, and Inflation Pt 2
3/ Nasdaq Living on the Edge
4/ A Warning from Canada
Investopedia is partnering with CMT Association on this newsletter. The contents of this newsletter are for informational and educational purposes only, however, and do not constitute investing advice. The guest authors, which may sell research to investors, and may trade or hold positions in securities mentioned herein do not represent the views of CMT Association or Investopedia. Please consult a financial advisor for investment recommendations and services.
1/ Fed Funds, the S&P, and Inflation Pt. 1
Tomorrow is the long-awaited day of the Federal Open Market Committee (FOMC) meeting, where the world will learn what Chairman Powell is thinking. The market is pricing in with near certainty that the Fed will keep interest rates at their current level. One critical question, however, is, when the Fed begins cutting rates, is it bullish or bearish?
You’ll hear both arguments, but by studying the historical relationship between the Federal Funds rate and the stock market, the true answer is: it depends. It depends highly on whether the market is in an inflationary or deflationary environment. Chart 1 (below), which captures the inflationary period of the late 1960s to early 1980s, shows that a drop in the Federal Funds rate led to sizable bull market rallies. A cut in the rate would coincide with falling inflation, which was the primary worry for investors at the time.
This relationship changed drastically going forward, leading to the never-ending debate about whether falling Federal Fund rates are a positive or ominous sign.

2/ Fed Funds, the S&P, and Inflation Pt. 2
Once Chairman Volcker put the inflation genie back in its bottle with historically high interest rates, the relationship between the Federal Funds rate and stocks completely shifted. As can be seen in Chart 2 (below) beginning in the late 1980s, the market fell over quite dramatically whenever the Fed began lowering interest rates, rather than rally. So what happened? Why the dramatic change in response?
Once the inflation shock ended, investors’ primary concern shifted from high inflation to a weakening economy. Investors no longer worried about inflation getting out of control, but they did worry that the Fed would induce a recession. Therefore, falling Federal Fund rates typically reflected the Fed attempting to resuscitate a decelerating economy – the very problem induced by the Fed preemptively working to stave off entrenched inflation.
So, where does this leave us now? No two markets are ever the same, but we can use past parallels to anticipate what might happen next. We are in an inflationary environment similar to the 1970s, and therefore, when the Fed finally cuts rates, it should be bullish. However, many variables are quite different than that era.
Some wisdom from legendary investor Bruce Kovner can be quite helpful. At times, he would see the equal possibility of a bullish and bearish outcome from a macro development. He simply let the market breakout in price after new vital economic data was released. The market would be far better at weighing the multitude of variables in such complex situations.
The 1970s precedent makes a bullish argument, but it would need to be followed by an upside breakout in markets once Federal Fund rates finally begin to fall lower.

3/ Nasdaq Living on the Edge
Leadership is an important concept when studying the market. Market leaders can be loosely defined as the stock or index that outperforms its peers within a market cycle. These securities tend to begin their uptrend first, outpace their peers, and ultimately fall the fastest once the cycle ends.
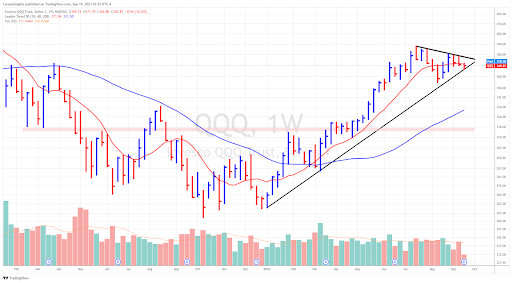
The undoubted leading index of 2023 is the Nasdaq 100, as it has trounced all other major indexes YTD. As seen in Chart 3, it is consolidating its gains as it rests firmly on its 2023 uptrend line. It also sits below a much shorter overhead downtrend line.
The AI-fueled spring/summer rally leaves the index extended from support levels. A downside break of this trendline could lead to 13 to 15% losses before finding support at the April highs. However, a bullish forecast by Fed Chairman Powell could equally lead to an upside breakout, as I discussed in the prior section. For investors seeking trends, now is an ideal time to watch attentively as sideways consolidations build up large amounts of energy that launch significant trends.
4/ A Warning from Canada
Today saw the S&P 500 rally back from more significant losses to close down only 0.21%. The same could not be said for Canada’s S&P TSX Composite index. The TSX closed down 1.25% as inflation rose significantly above expectations (4.0% vs. 3.8% expectation.) This TSX reaction is an important reminder that the US market is up YTD as it benefits from falling inflation. If that trend were to turn higher, it would likely be harmful for the general market.

—
Originally posted 20th September 2023
Disclosure: Investopedia
Investopedia.com: The comments, opinions and analyses expressed herein are for informational purposes only and should not be considered individual investment advice or recommendations to invest in any security or to adopt any investment strategy. While we believe the information provided herein is reliable, we do not warrant its accuracy or completeness. The views and strategies described on our content may not be suitable for all investors. Because market and economic conditions are subject to rapid change, all comments, opinions and analyses contained within our content are rendered as of the date of the posting and may change without notice. The material is not intended as a complete analysis of every material fact regarding any country, region, market, industry, investment or strategy. This information is intended for US residents only.
Disclosure: Interactive Brokers
Information posted on IBKR Campus that is provided by third-parties does NOT constitute a recommendation that you should contract for the services of that third party. Third-party participants who contribute to IBKR Campus are independent of Interactive Brokers and Interactive Brokers does not make any representations or warranties concerning the services offered, their past or future performance, or the accuracy of the information provided by the third party. Past performance is no guarantee of future results.
This material is from Investopedia and is being posted with its permission. The views expressed in this material are solely those of the author and/or Investopedia and Interactive Brokers is not endorsing or recommending any investment or trading discussed in the material. This material is not and should not be construed as an offer to buy or sell any security. It should not be construed as research or investment advice or a recommendation to buy, sell or hold any security or commodity. This material does not and is not intended to take into account the particular financial conditions, investment objectives or requirements of individual customers. Before acting on this material, you should consider whether it is suitable for your particular circumstances and, as necessary, seek professional advice.
Disclosure: ETFs
Any discussion or mention of an ETF is not to be construed as recommendation, promotion or solicitation. All investors should review and consider associated investment risks, charges and expenses of the investment company or fund prior to investing. Before acting on this material, you should consider whether it is suitable for your particular circumstances and, as necessary, seek professional advice.


Join The Conversation
If you have a general question, it may already be covered in our FAQs. If you have an account-specific question or concern, please reach out to Client Services.