


By Todd Stankiewicz CMT, CFP, ChFC
1/ Recession Probabilities
2/ Long Bond Exhausted
3/ US Dollar Index (UUP) Potential Top
4/ The S&P500 Index is Looking for Support
Investopedia is partnering with CMT Association on this newsletter. The contents of this newsletter are for informational and educational purposes only, however, and do not constitute investing advice. The guest authors, which may sell research to investors, and may trade or hold positions in securities mentioned herein do not represent the views of CMT Association or Investopedia. Please consult a financial advisor for investment recommendations and services.
1/ Recession Probabilities
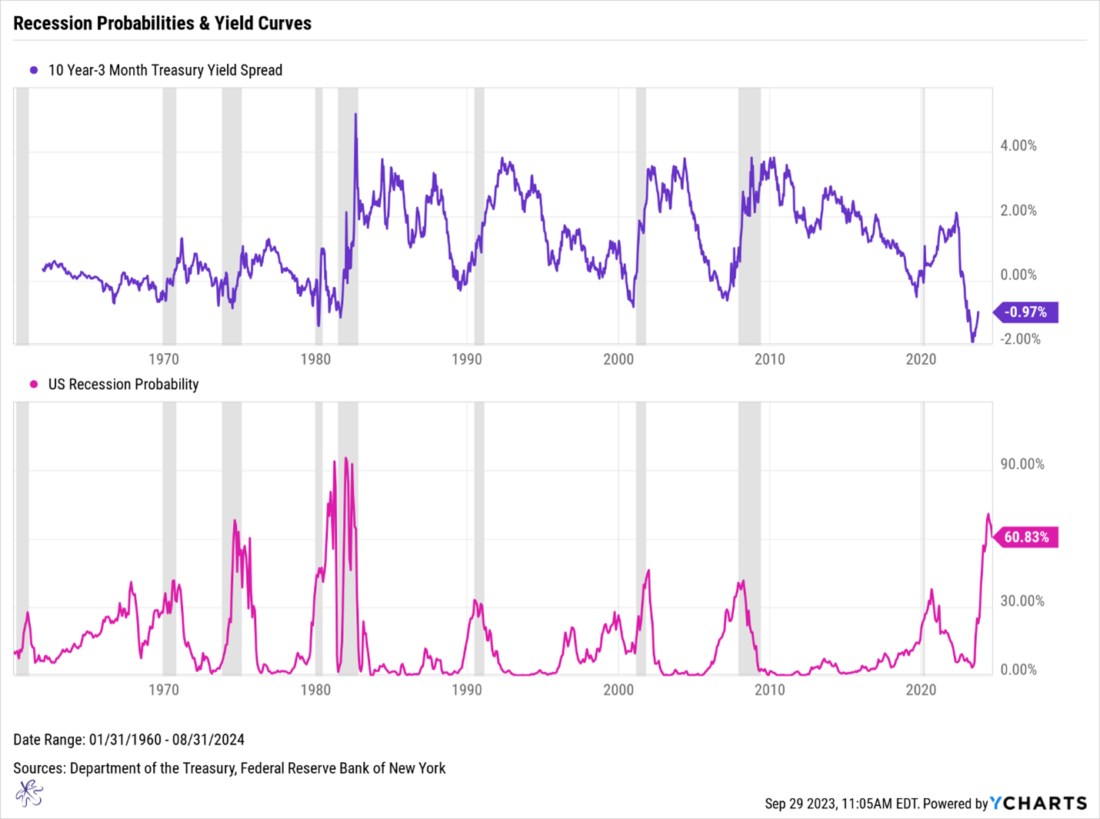
As the saying goes, the bond market is the “smart money.” Because of this we should heed the potential message the treasury market is sending us. The 10-year minus 3-month treasury yield curve has inverted to the deepest levels in over 4 decades. The recession probabilities in the lower chart are directly calculated from the 10-year minus 3-month treasury yield spread in the top chart, looking 12 months forward. This means that the recession probabilities today are based on the yield curve from 12 months ago. This deeply inverted yield curve is resulting in the highest recession risk probabilities since the early 1980’s. This has been a very reliable indicator over time of recession risk. The recession periods are marked in grey.
There has been a lot of discussion about this time being different, and it may be different, but it is still too early to tell. To truly confirm the soft landing, we need to see the yield curve normalize and recession risks abate while avoiding an economic downturn.
2/ Long Bond Exhausted
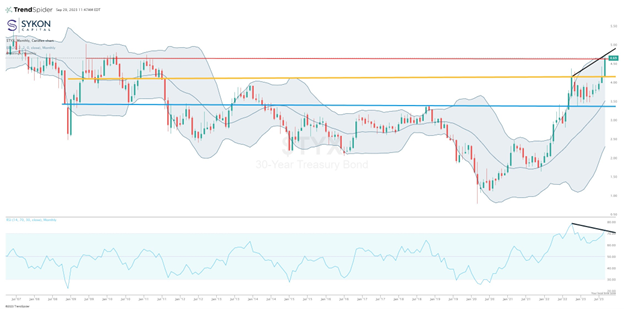
During September, the 30-year treasury yield (TYX) jumped to the highest level since February 2011. It spiked to 4.67% from 4.2% at the end of August. With this move, the yield is now bumping into a myriad of resistance levels. The first level is where the long bond yield rallied and failed in May 2008, May 2009, March 2010, and then February and March of 2011. The second resistance level is the upper Bollinger Band.
These resistance levels are also coinciding with an overbought monthly Relative Strength Index (RSI) at 73. Additionally, there is a bearish divergence present. This is where the most recent yield moved to a higher high while the RSI made a lower high. Remember, bond prices move inversely to yields. When yield declines, the price of the treasuries will increase as a result.
There is a high probability that long dated treasury yields at least take a pause at these levels, but more than likely we could see lower yields in the short term. If there is a move lower, look for a potential retest of the most recent break out at 4.2% (yellow support line). If the 30 year fails to find support here, it would put the blue support line in play around 3.45%.
3/ US Dollar Index (UUP) Potential Top
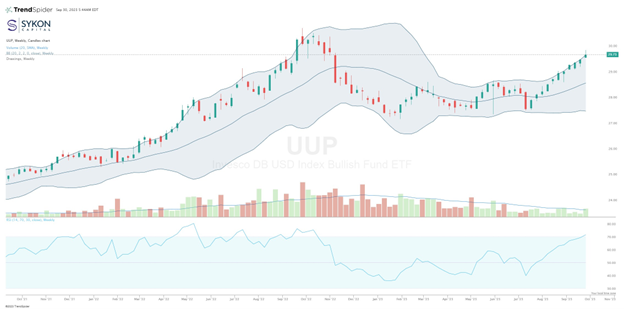
The recent rise in treasury yields has pushed the Invesco DB USD Bullish Fund EFT (UUP), a proxy for the US Dollar index (DXY), into extreme overbought conditions and increases the potential for a short-term top. The most recent candle is a shooting star. This indicates a level where the bears have taken control and reversed a bullish candle. I believe the bulls are exhausted at this level.
Earlier this week the bulls pushed UUP above the upper Bollinger Band, indicating it was overbought. In line with this, the weekly Relative Strength Index (RSI) also moved into overbought conditions as it has increased above the important 70 level. This raises the probability that weakness will occur at the current levels. Watch for a retest of the middle Bollinger band at 28.62. If it finds support at this level, the expectation is that it recovers to the upper band to potentially resume the uptrend. A failure here could mean a move to the lower band at 27.54. A decline in the US Dollar index could potentially be a tailwind to non-US Dollar investments.
4/ The S&P500 Index is looking for Support
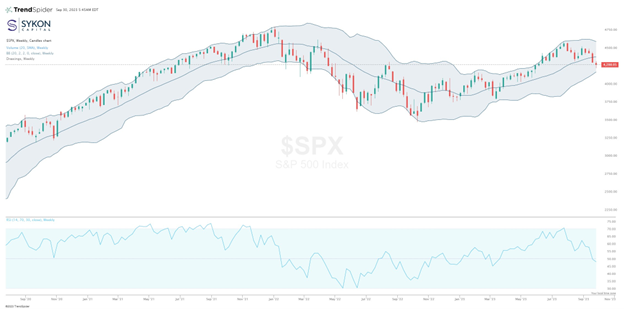
The S&P500 index (SPX) weekly chart is searching for support after breaking below the middle Bollinger Band. At the same time the RSI is breaking down below the 50 level, which indicates a potential trend shift for the index. It will be important for the S&P500 index to find support at the lower Bollinger band level of 4190. If support is established and it bounces, we will see if the index can regain control and move back over the middle band. A failure to hold the lower Bollinger Band will increase the possibility that it rides this band lower.
This is like what happened in January 2022. The index found initial support at the lower band and bounced back to the middle band before ultimately failing at the resistance and riding the lower band to one of the worst years for the index since the Great Financial Crisis. Know your levels as they relate to your risk.
—
Originally posted 2d October 2023
Disclosure: Investopedia
Investopedia.com: The comments, opinions and analyses expressed herein are for informational purposes only and should not be considered individual investment advice or recommendations to invest in any security or to adopt any investment strategy. While we believe the information provided herein is reliable, we do not warrant its accuracy or completeness. The views and strategies described on our content may not be suitable for all investors. Because market and economic conditions are subject to rapid change, all comments, opinions and analyses contained within our content are rendered as of the date of the posting and may change without notice. The material is not intended as a complete analysis of every material fact regarding any country, region, market, industry, investment or strategy. This information is intended for US residents only.
Disclosure: Interactive Brokers
Information posted on IBKR Campus that is provided by third-parties does NOT constitute a recommendation that you should contract for the services of that third party. Third-party participants who contribute to IBKR Campus are independent of Interactive Brokers and Interactive Brokers does not make any representations or warranties concerning the services offered, their past or future performance, or the accuracy of the information provided by the third party. Past performance is no guarantee of future results.
This material is from Investopedia and is being posted with its permission. The views expressed in this material are solely those of the author and/or Investopedia and Interactive Brokers is not endorsing or recommending any investment or trading discussed in the material. This material is not and should not be construed as an offer to buy or sell any security. It should not be construed as research or investment advice or a recommendation to buy, sell or hold any security or commodity. This material does not and is not intended to take into account the particular financial conditions, investment objectives or requirements of individual customers. Before acting on this material, you should consider whether it is suitable for your particular circumstances and, as necessary, seek professional advice.
Disclosure: ETFs
Any discussion or mention of an ETF is not to be construed as recommendation, promotion or solicitation. All investors should review and consider associated investment risks, charges and expenses of the investment company or fund prior to investing. Before acting on this material, you should consider whether it is suitable for your particular circumstances and, as necessary, seek professional advice.
Disclosure: Forex
There is a substantial risk of loss in foreign exchange trading. The settlement date of foreign exchange trades can vary due to time zone differences and bank holidays. When trading across foreign exchange markets, this may necessitate borrowing funds to settle foreign exchange trades. The interest rate on borrowed funds must be considered when computing the cost of trades across multiple markets.


Join The Conversation
If you have a general question, it may already be covered in our FAQs. If you have an account-specific question or concern, please reach out to Client Services.