


10-Year Treasury Rates: A Monthly/Secular Perspective Overview
Investopedia is partnering with CMT Association on this newsletter. The contents of this newsletter are for informational and educational purposes only, however, and do not constitute investing advice. The guest authors, which may sell research to investors, and may trade or hold positions in securities mentioned herein do not represent the views of CMT Association or Investopedia. Please consult a financial advisor for investment recommendations and services.
10-Year Treasury Rates: A Monthly/Secular Perspective Overview
I begin each year by reviewing the long-term technical positions and behaviors of what I think of as the “Big Four”—10-Year rates, S&P 500 ($SPX), Commodities, and the US Dollar. I believe that rates, particularly in a credit dependent/leveraged system, generally drive both the economic and market cycles. And, since by profession I am a rates/credit portfolio manager, strategist and trader, I always begin there.
Granted, a macro view doesn’t often inform short term trading, but anything that helps me understand the ebb and flow and interconnectedness of markets is helpful. More importantly, recognizing markets that are aligned for significant macro change can be invaluable, particularly in terms of risk management.
Since most good technical analysis is fractal, the same techniques used to describe the macro ebb and flow can often translate to shorter time frames. For the first two decades of my trading career I kept a manual grid of the big 4 plus a few other markets (gold, oil, 2-year Treasury and so forth) that I updated hourly with price and the change from the prior hour. By doing so, I learned a great deal about market interactions and interrelationships.
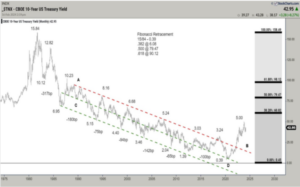
Monthly 10-Year Note Yield
<<A reminder that falling bond yields are synonymous with higher bond prices. In other words, a downtrend in yield = a bull market in bonds.>>
Over the last four decades bond yields had consistently and reliably made lower highs and lower lows. The entire bull market was defined by a broad declining channel (A–B, C–D). The A–B downtrend line represented the “stride of demand” or the zone where buyers consistently emerged and the C–D line represented the “overbought line” or the zone where supply or sellers consistently emerged.
From 2012 forward there were growing signs that the long downtrend was aging. Four things stood out.
- The repeated failure to push to the oversold line (C–D).
- The flattening out of the decline where each push to a new yield low only covered around 100 bps.
- The 2018 spike to 3.24% that weakened the primary A-B downtrend.
- In March of 2020 bonds pushed to the area around the center of the channel, failed to push beyond the midline much less into the overbought line (C–D). This change of behavior strongly suggested that demand was tiring. Multiple visible changes of behavior strongly suggested that the 40-year downtrend was in danger of terminating.
Now, the clear break and acceleration above the A–B downtrend has moved the long trend from bullish to neutral. While it’s likely that the move above November 2018 pivot @ 3.24% coupled with the prior changes of behavior mark the beginning of a long-term bear market, a higher low (perhaps forming in 2024) is needed to complete/confirm that change.
Note the additional changes in behavior. The 459 bps move from 0.39% to 4.98% represents the single largest bearish move since the inception of the bull market in September 1981, and the MACD oscillator level far exceeded the levels that marked yield highs over the course of the entire bull market.
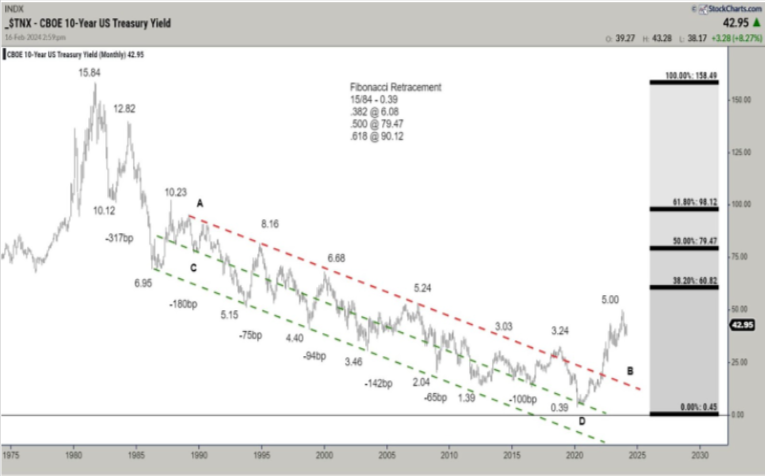
10-Year Monthly with MACD
After producing the most overbought reading since the 1980s, the oscillator is trying to roll over and displaying a small negative divergence (suggesting lower yields and higher price). While not a definitive roll, it certainly suggests that there is some potential for a meaningful turn.
Monthly 10 Year Note Yield:
The following are several key fundamental points around rates:
- The defining macro characteristic of the 40-year bull market has been the continual fall in the inflation rate. If that is changing (I believe that it has), the secular bond trend is likely to also change.
- If the trend in inflation is changing, the negative correlation between bonds and equity that drives 60/40 allocation and risk parity investing is likely to flip and become positive. In other words, bonds and equity would, outside of periods of panic or economic distress, rise and fall together destroying the diversification benefit. This has been the historical norm and I expect that the market will gradually move in that direction.
- The caveat being: Quantitative easing removed the value proposition from bonds, when equities began to decline in 2022 bonds couldn’t provide a safe haven. They were already far too expensive, particularly in the context of a Federal Reserve aggressively tightening monetary policy. That is no longer the case. Bonds, while still expensive, can again provide a tactical hedge should risk assets or the economy weaken dramatically.
- At first glance, this seems at odds with the change in correlation discussed above, but it is a difference between the secular tide versus the intermediate wave.
- Most substantive bond rallies are the result of a crisis that creates a flight-to-quality. In an economy that is overly financialized and levered, rising rates often break the weakest link in the economic chain, creating a new crisis and a subsequent flight to quality rally. While so far, there is little evidence of a systemic crisis, the lagged effect of the rapid increase in rates in an overly financialized system must be top of mind.
While there is still more work to be done to confirm the trend change, I believe the bond trend is finally changing as the world moves from the deflationary backdrop of the last several decades to an inflationary backdrop. I will be a much better seller of rallies and bearish technical setups in the weekly/intermediate perspective.
Good Trading:
Stewart Taylor, CMT
Chartered Market Technician
—
Originally posted on March 11th 2024
Disclosure: Investopedia
Investopedia.com: The comments, opinions and analyses expressed herein are for informational purposes only and should not be considered individual investment advice or recommendations to invest in any security or to adopt any investment strategy. While we believe the information provided herein is reliable, we do not warrant its accuracy or completeness. The views and strategies described on our content may not be suitable for all investors. Because market and economic conditions are subject to rapid change, all comments, opinions and analyses contained within our content are rendered as of the date of the posting and may change without notice. The material is not intended as a complete analysis of every material fact regarding any country, region, market, industry, investment or strategy. This information is intended for US residents only.
Disclosure: Interactive Brokers
Information posted on IBKR Campus that is provided by third-parties does NOT constitute a recommendation that you should contract for the services of that third party. Third-party participants who contribute to IBKR Campus are independent of Interactive Brokers and Interactive Brokers does not make any representations or warranties concerning the services offered, their past or future performance, or the accuracy of the information provided by the third party. Past performance is no guarantee of future results.
This material is from Investopedia and is being posted with its permission. The views expressed in this material are solely those of the author and/or Investopedia and Interactive Brokers is not endorsing or recommending any investment or trading discussed in the material. This material is not and should not be construed as an offer to buy or sell any security. It should not be construed as research or investment advice or a recommendation to buy, sell or hold any security or commodity. This material does not and is not intended to take into account the particular financial conditions, investment objectives or requirements of individual customers. Before acting on this material, you should consider whether it is suitable for your particular circumstances and, as necessary, seek professional advice.


Join The Conversation
If you have a general question, it may already be covered in our FAQs. If you have an account-specific question or concern, please reach out to Client Services.