


Investopedia is partnering with CMT Association on this newsletter. The contents of this newsletter are for informational and educational purposes only, however, and do not constitute investing advice. The guest authors, which may sell research to investors, and may trade or hold positions in securities mentioned herein do not represent the views of CMT Association or Investopedia. Please consult a financial advisor for investment recommendations and services.
1/
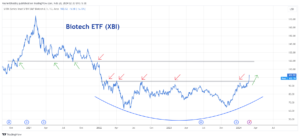
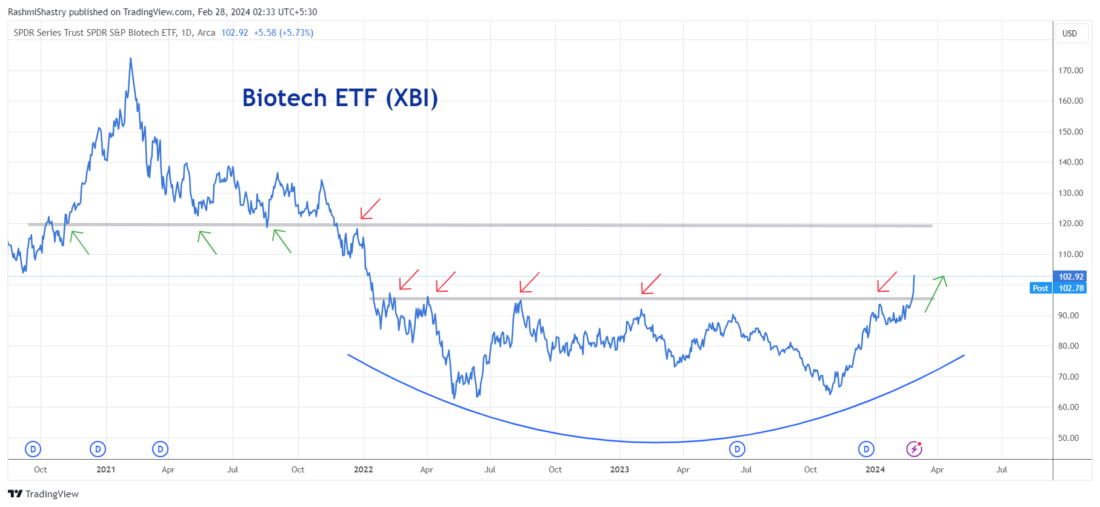
Moving from Tech to Biotech
Healthcare broke out from a two and half year sideways trading range early this month. Healthcare comprises multiple sub groups: Biotechnology, Medical Equipment, Medical Supplies, Pharmaceuticals, and Health Care Providers. So far we saw participation coming through Pharmaceuticals and Medical Supplies.
We now have a breakout come through in Biotechnology as well. This is textbook- style sector rotation followed by broadening sectoral participation.
The price is breaking out of a big base breakout, greater than two years. We can see multiple attempts made by this sub-group to break out above the resistance zone. The more times a level is tested, the more likely it is to break! From the ETF perspective the next zone of resistance to track comes in at 120.
2/
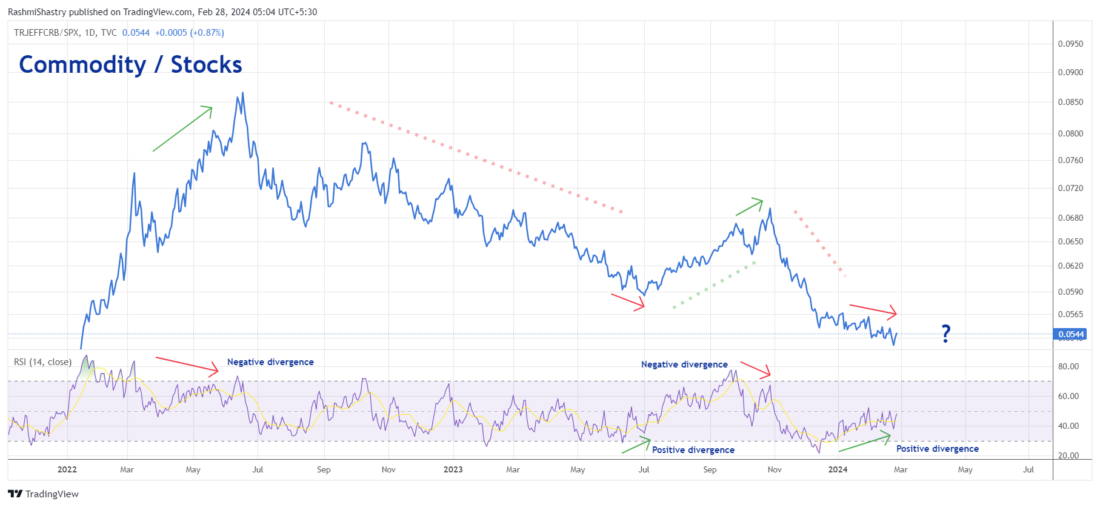
Commodities Looking for Attention
When identifying which asset class to remain overweight, it is necessary to do a relative strength analysis. Here, we’re looking at Commodities in the numerator and Stocks in the denominator. If this ratio moves higher, commodities are outperforming, and vice versa.
The more important concept to focus upon here is divergence. This seems like a great example to allude to what follows after a divergence. In mid 2022, the ratio made a higher high, but the indicator (14-period RSI) marked a lower high. This was a change in momentum that led to the change in a trend that witnessed commodities passing on the momentum baton to stocks. In mid-July, however, a positive divergence occurs. A lower low in price is accompanied by a higher low in the indicator. What followed was a nice rebound in commodity strength. Although the longer-term trend remains the same with stocks outperforming commodities, the short-term story could change. With the latest data in place, while price made a lower low, the indicator made a higher low. Could this signal a short-term outperformance coming through in commodities? It is possible!
3/
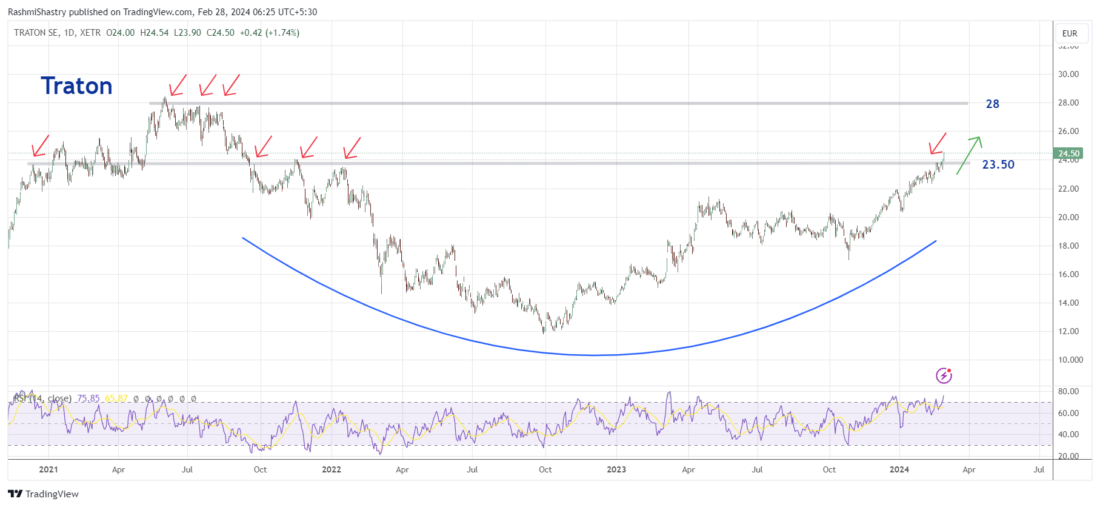
German Industrial Stock on Radar
We spoke of DAX 40 making new all-time highs and how a majority (21.16%) comprise industrials. So I did a little digging to see if there was some steam left in the industrial stocks that are driving this market higher.
Turns out, there is. Traton Group is actually a subsidiary of the Volkswagen Group and is a truck and transport services industry, one of the world’s largest commercial vehicle manufacturers. The stock price seems to have broken out of a large two-and-a-half years, as it moved past 24.50. With bullish momentum readings in the indicator and positive market momentum, the next zone of resistance comes close to 28.
4/
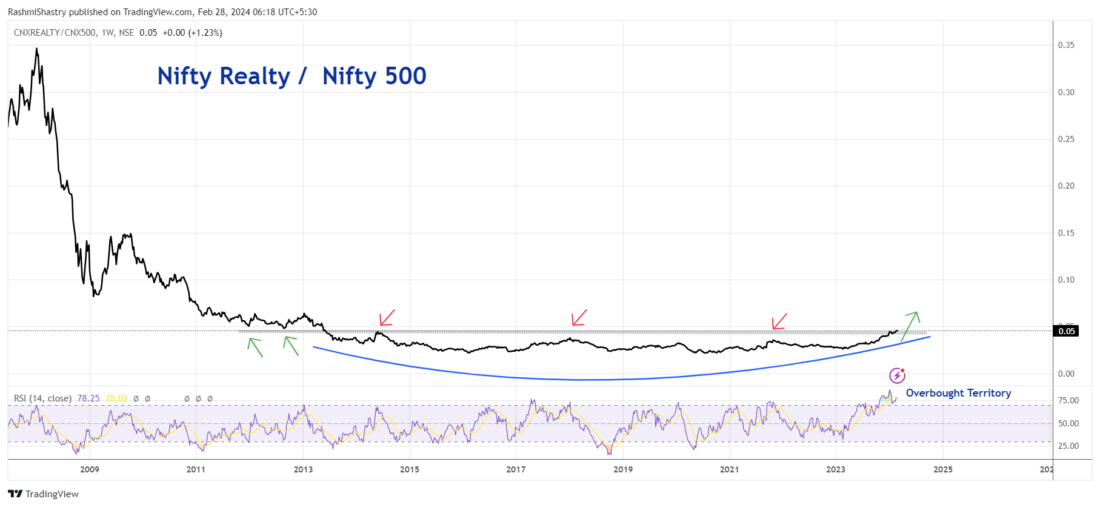
Nifty Realty Changing Gears
Nifty Realty has been making big strides since its breakout in September 2023. Here is a relative strength chart of Nifty Realty compared to Nifty 500 (the broader market index). Although on an absolute basis Realty has been covering ground, the relative strength ratio has only now peeped out of the ground. Moreover, the overbought reading in the indicator suggests that this strength is here to stay, with more stocks participating in this move going forward. This is a massive 13-year base breakout and it will be important to note if the ratio can hold on to it on a weekly closing basis, but for now, Nifty Realty continues to give the green signal.
5/
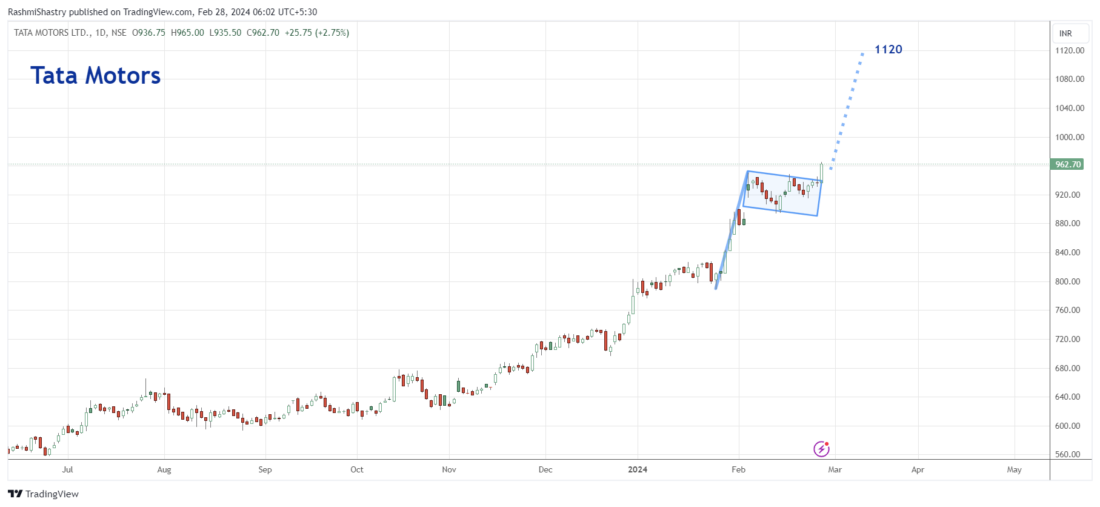
Tata Motors Leading Auto Stocks
Tata Motors, a leading Automobile company belonging to the Tata Conglomerate has been generating strong returns for investors as Auto stocks continue to rally.
In this chart, we can see that a robust price move has formed a flag-pattern. The stock is not breaking out of this move, which is typically followed by a swift movement towards the target.
As Nifty auto continues to display absolute and relative strength, Tata Motors is ready to move higher towards 1120. I once heard an analyst refer to new price territory as purple skies, and that stuck with me. So here we have Tata Motors in purple sky territory!
—
Originally posted on February 28th 2024
Disclosure: Investopedia
Investopedia.com: The comments, opinions and analyses expressed herein are for informational purposes only and should not be considered individual investment advice or recommendations to invest in any security or to adopt any investment strategy. While we believe the information provided herein is reliable, we do not warrant its accuracy or completeness. The views and strategies described on our content may not be suitable for all investors. Because market and economic conditions are subject to rapid change, all comments, opinions and analyses contained within our content are rendered as of the date of the posting and may change without notice. The material is not intended as a complete analysis of every material fact regarding any country, region, market, industry, investment or strategy. This information is intended for US residents only.
Disclosure: Interactive Brokers
Information posted on IBKR Campus that is provided by third-parties does NOT constitute a recommendation that you should contract for the services of that third party. Third-party participants who contribute to IBKR Campus are independent of Interactive Brokers and Interactive Brokers does not make any representations or warranties concerning the services offered, their past or future performance, or the accuracy of the information provided by the third party. Past performance is no guarantee of future results.
This material is from Investopedia and is being posted with its permission. The views expressed in this material are solely those of the author and/or Investopedia and Interactive Brokers is not endorsing or recommending any investment or trading discussed in the material. This material is not and should not be construed as an offer to buy or sell any security. It should not be construed as research or investment advice or a recommendation to buy, sell or hold any security or commodity. This material does not and is not intended to take into account the particular financial conditions, investment objectives or requirements of individual customers. Before acting on this material, you should consider whether it is suitable for your particular circumstances and, as necessary, seek professional advice.
Disclosure: ETFs
Any discussion or mention of an ETF is not to be construed as recommendation, promotion or solicitation. All investors should review and consider associated investment risks, charges and expenses of the investment company or fund prior to investing. Before acting on this material, you should consider whether it is suitable for your particular circumstances and, as necessary, seek professional advice.


Join The Conversation
If you have a general question, it may already be covered in our FAQs. If you have an account-specific question or concern, please reach out to Client Services.