Investopedia is partnering with CMT Association on this newsletter. The contents of this newsletter are for informational and educational purposes only, however, and do not constitute investing advice. The guest authors, which may sell research to investors, and may trade or hold positions in securities mentioned herein do not represent the views of CMT Association or Investopedia. Please consult a financial advisor for investment recommendations and services.
ESG and SRI: Using Technical Analysis
Back in the day (and to me, that means the mid-2000’s) when I was 4+ years into my career, I had a new client ask if I managed “Socially Responsible” portfolio models.
First off, I hadn’t even heard of them, but I simply answered, “I don’t… but for you, I can.”
So, I looked into it, did some reading, and what I learned was that Socially Responsible Investing came in a few different versions back then. There were some mutual funds that avoided “sin” stocks (such as cigarettes, tobacco, and pornography), other funds were more religious-based in nature, but there weren’t a lot of them to choose from.
Still, I built a portfolio for this client and in the first few years, they stuck with it. A couple years later, the lag in performance caused them to want to move half of their money to a more “traditional” portfolio model, and within a total of maybe 6-7 years, they had completely exited the SRI model and I closed it down.
Today, however, there are way more options to choose from, and not only are the options vast, but there are also a lot of ETFs available that are much lower-cost than the old mutual funds that are still out there today. If that wasn’t good enough, the concept of SRI got a new name, and the industry started calling it Environmental, Social, & Governance (or ESG for short).
Fast forward a few more years and again, we had a new client reach out and ask if this was something we did, but this time, there were so many more options to pick from, so I built another ESG/SRI model and the back-testing came in much better than the lagging performance we experienced from the old mutual fund models.
1/ Mutual Funds vs ETFs
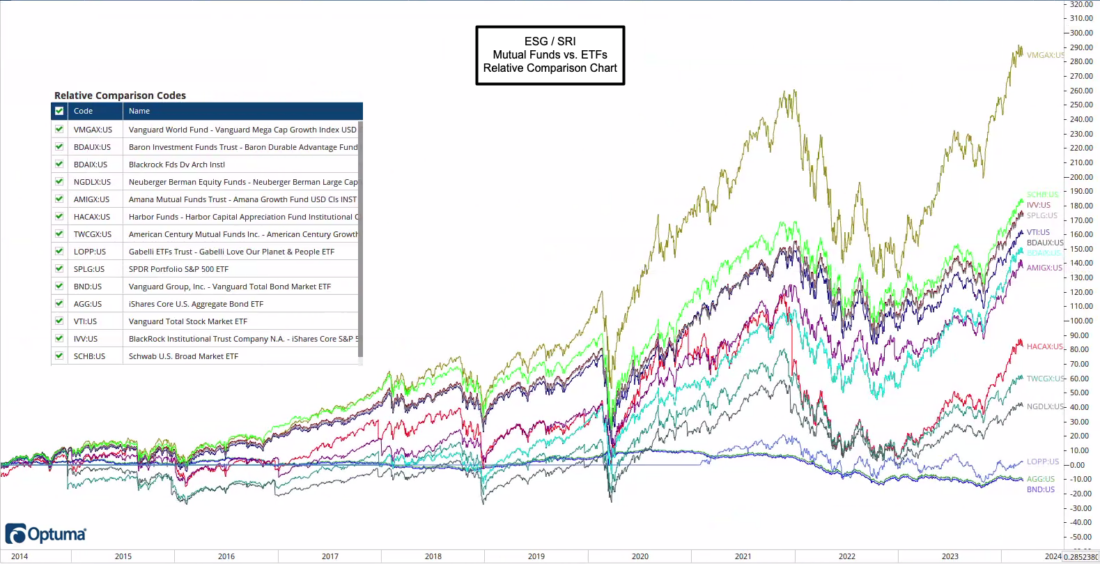
Just for fun, let’s start with answering the questions, “Are mutual funds better than ETFs or Stocks?”
To be fair, I simply googled the best ESG and SRI mutual funds and ETFs in 2023 and got this article from Nerd Wallet as opposed to cherry picking my own funds to show my bias.
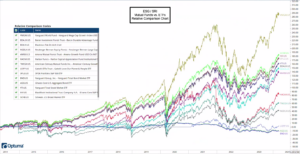
As you can see in the relative comparison chart above, the #1 performing ESG option is, in fact, a mutual fund (Vanguard’s World Fund), however, the 2nd, 3rd, and 4th place winners are all ETFs – and again, in the interest of fairness, the article included the top-performing ESG funds over the last 5 years… and then listed the lowest-cost ETFs with no regard to ROR. In other words, this was definitely not fair to the ETFs in question, but still, 3-of-7 ended up in the top-4, so that’s saying something!
Anyway, in case you can’t tell what my bias is, I’m a fan of lower-cost, passive ETFs than I am mutual funds. In fact, we haven’t used a mutual fund at our office in any portfolio models since we closed down the first ESG/SRI model “way back when” (there’s that phrase again).
Oh, and individual stocks can add some serious spice to an ESG portfolio, by the way. You just have to ensure you’ve got a process for picking the right ones and managing risk along the way, so let’s talk about that…
The first thing you need to do in order to build an ESG/SRI stock model is to build an inventory of companies that qualify as being “socially responsible.”
I didn’t use either of the lists that follow, but to give you a start, here’s a list of the 10 Most Popular Stocks for ESG Funds from Investopedia, and then here’s an even bigger list from IBD.
It would be my recommendation to have an inventory that is much larger than 10 stocks, so please expand your list to at least 30-40. There are other lists out there – I personally built my list of more than 100 names from an inventory that started as a socially responsible index, for instance.
2/ Ranking the Stocks
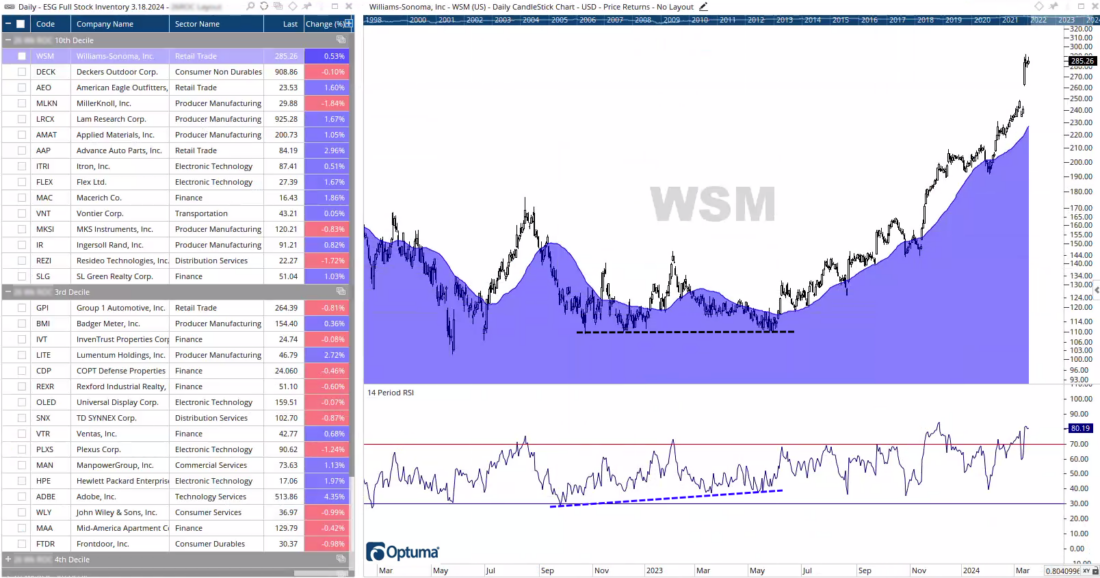

From there, one great way to rank the stocks is by using relative strength. This can be a ranking of performance over time, it can be days, weeks, months, you can use a Relative Rotation Graph, or you can remove time altogether and use a Point & Figure chart (or matrix), as I’ll explain later.
For the above-listed inventory, I used a weekly ranking system over time and broke them out into deciles. From there, I can then make my life easier by focusing only on the high-RS stocks, then analyzing the chart for each at the right, observing trend and momentum.
In this case, Williams Sonoma (WSM) ended up being the top-ranked stock, and I also noticed that there was a positive divergence that came out of momentum last spring, and the stock followed through to the northside in summer.
3/ Analyzing the Low Rank
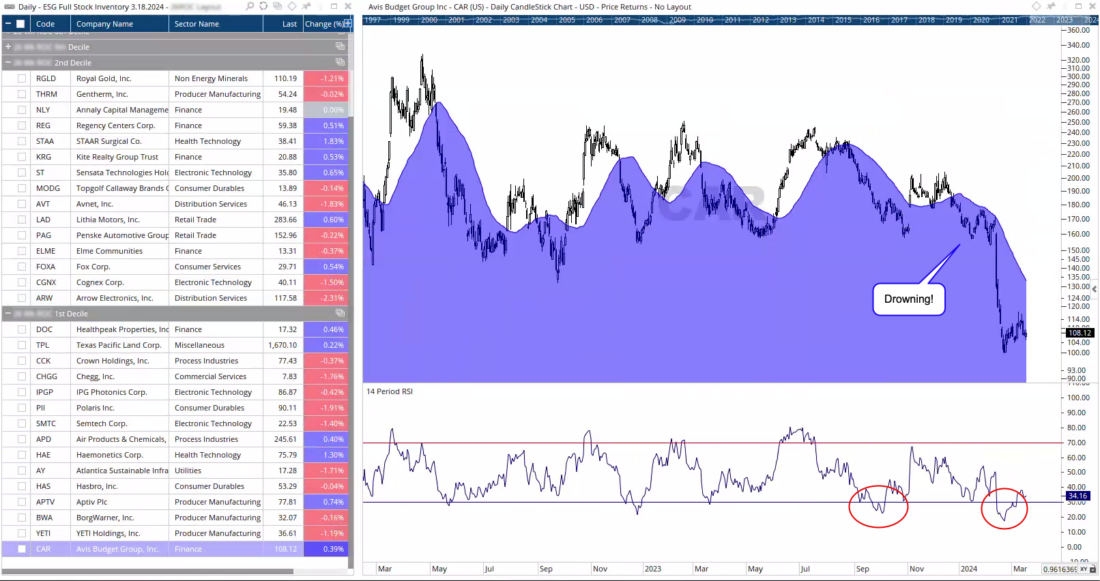

Now that we know what to do, let’s discuss what NOT to do. The above listed stock is Avis Budget Group (CAR), and it also happens to be the bottom-ranked stock in the ranking system.
You can analyze the chart at the right (but be careful if you have a weak stomach), and along with its awful ranking, you can see a clear downtrend, a stock drowning below its 200-day moving average, with some terrible momentum staring you in the face from our friend, RSI in the bottom pane.
This is a good time to say that, in technical analysis, we don’t care much about the company’s story, what it’s P/E ratio is, or if it’s “gone up too much.” We care about buying strong stocks in strong sectors, in strong asset classes with strong trends and strong momentum – we like buying stocks that are going up… not stocks that are going down.
4/ Relative Rotation Graph
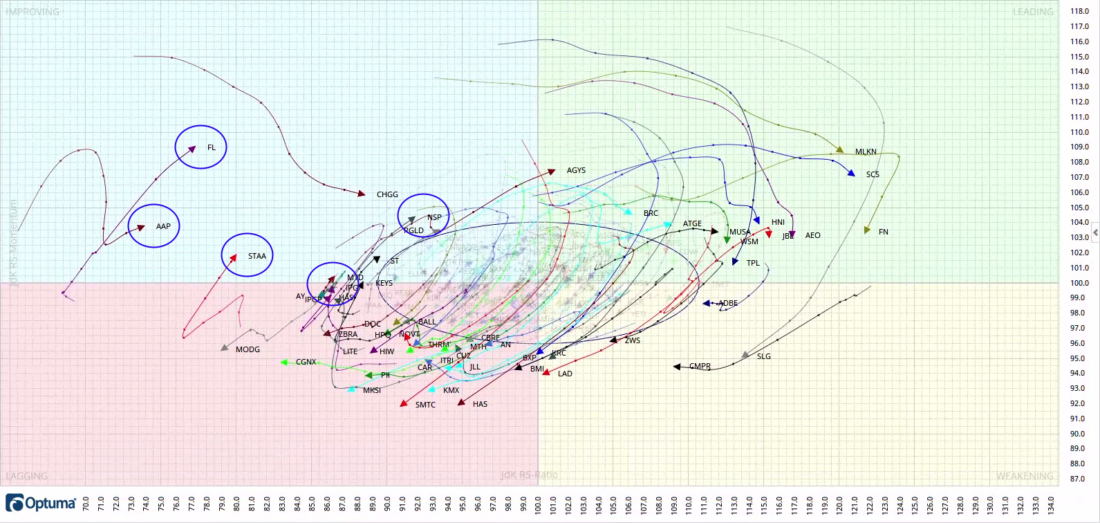

Here’s another way to pick ESG/SRI stocks – with a Relative Rotation Graph (or RRG for short). This might look like a lot of spaghetti at first, but it’s actually one of THE best ways to visualize relative strength (or high-RS stocks). First, let’s understand the quadrants on the chart:
- Upper left = Improving vs. the benchmark
- Upper right = Leading the benchmark
- Lower right = Weakening vs. the benchmark
- Lower left = Lagging the benchmark
The “benchmark” is whatever you want it to be, but in this case, it’s the S&P500, and it lies at the zero point on the x/y axis.
Now, you might think to yourself, “I want to own stocks that are leading the benchmark,” right? Well, you’re close – but entry points using RRGs requires a little art, a little science, and a lot of testing.
Nerd’s Note: That oblong oval I added to the middle of the chart isn’t a portal… it’s an area that measures 2 standard deviations from the benchmark on a relative basis. The purpose is to “weed out” all the stocks that are trading near-center. Stocks that are behaving with roughly the same or similar RS to the market overall.
I circled a few stocks in the RRG above. Notice what they all have in common? They’re all exiting the lagging quadrant, pointing northeast, and have entered the improving quadrant.
Now, buying a stock that is still in the lagging quadrant, but pointing northeast and moving toward the improving quadrant can be an even better entry point. Furthermore, buying a stock that has already left the leading quadrant, but it’s done a 180-degree turn and “jackknifed” back upward, where it’s pointing northeast again, toward the leading quadrant… this can also be a great entry point as well.
In either case, once you identify potential candidates for your portfolio, you then must analyze the individual chart, look for trend, momentum, and above all, know what your exit strategy is before you even get in.
5/ RRG Animated
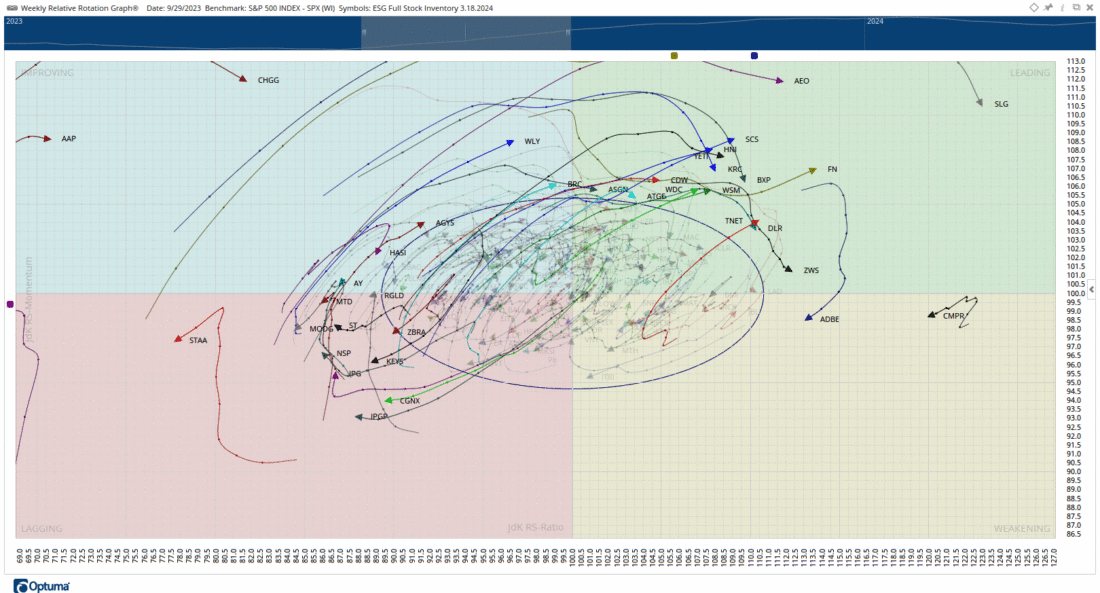

I showed you what a static RRG looks like using my inventory of ESG/SRI stocks today, but I thought it would be fun to animate the chart, just to show you how these things work over time.
Notice anything about the direction of the rotation for most of the stocks on the chart? Yep – they’re generally moving clockwise. This is why I mentioned that RRGs are one of the best ways to visualize relative strength – and if nothing else, a chart like this is outright proof that RS exists!
Since we expect the chart to move clockwise, then we know that eventually, the stocks we buy will end up failing, falling out of favor, and lagging the market. For this reason, I feel it’s necessary to repeat the fact that having an exit strategy is so crucial to the success of any portfolio management model.
Firefighters, SWAT teams, the Navy Seals – none of them go into battle without an exit strategy – and when it comes to your money, you shouldn’t, either.
6/ Point and Figure
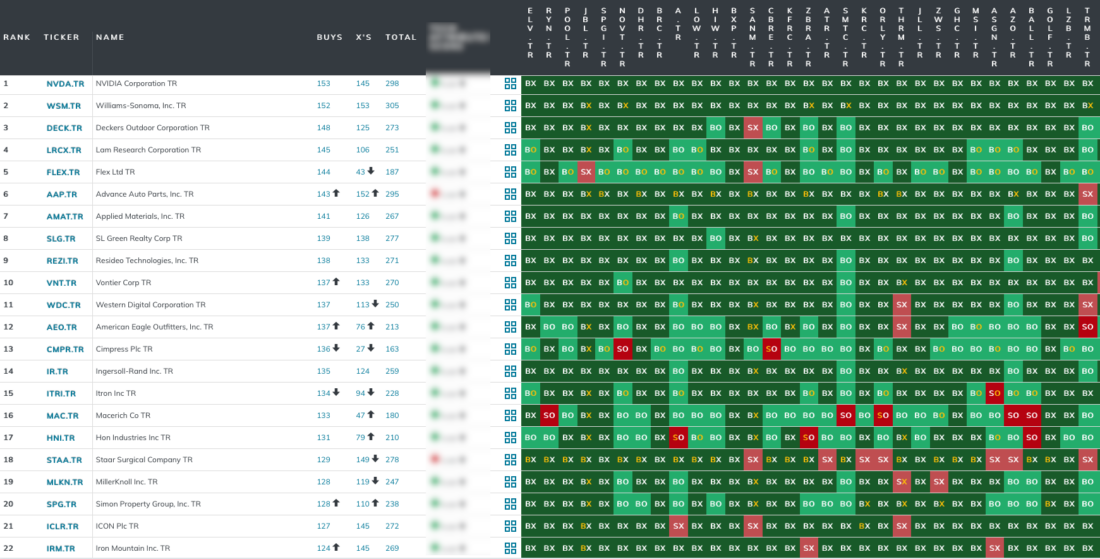

This is my last issue on Investopedia’s Chart Advisor this time around – and this is my last chart of the issue. Sorry it’s so messy, but I promised (above) that I’d show you how to remove time from a ranking system, and doing so is all about using Point & Figure (PnF) charts, which can get a little messy-looking (instead of spaghetti, PnF matrices look more like chess boards).
There are a couple ways to use it as a ranking system, but I’m going to focus on the simplest – a buy-signal ranking system.
If you look down the list on the left, you’ll see the list of symbols and stocks. Then, if you look across the top-right, you’ll see the same exact symbols (although, I ran out of screen room and couldn’t screenshot all of them, but they’re all there).
What’s happening here is, each stock is essentially “going into battle” with every other stock in a round-robin, battle royale. Each and every day, this matrix refreshes and it gives me a new ranking system based on the price movements of the most recently closing price for each stock.
Because PnF charts don’t use time as an input, if there is no price movement, then there would be no change in the ranking. In fact, while very unlikely, we could go six months and if there wasn’t a single move in price for any of the stocks in the matrix, then there would be no change in ranking!
A “buy signal” simply means that the stock has printed a higher-high on a PnF chart using a 3-box reversal method. Again, I don’t want to make this more complicated than it needs to be, but let’s just say that each buy-signal is a “win” for that stock, and when all those wins are tallied up, the one with the most buy signals is the top-ranked stock, second-most is the second-ranked stock, and so on.
In the end, you find yourself with a ranking system that observes price, alone, with no time accounted for in your back test. So, if there are a big movements in price, but with no regard for time, then the ranking system will change.
While PnF doesn’t get a lot of attention, I feel they’re a great tool to have in your toolbox of technical indicators and ranking systems… but it should go without saying, if I can say it one more time today – that no matter what your screening process for new investments – always, always, always have an exit strategy!
…until next time.
—
Originally posted on March 19th 2024
Disclosure: Investopedia
Investopedia.com: The comments, opinions and analyses expressed herein are for informational purposes only and should not be considered individual investment advice or recommendations to invest in any security or to adopt any investment strategy. While we believe the information provided herein is reliable, we do not warrant its accuracy or completeness. The views and strategies described on our content may not be suitable for all investors. Because market and economic conditions are subject to rapid change, all comments, opinions and analyses contained within our content are rendered as of the date of the posting and may change without notice. The material is not intended as a complete analysis of every material fact regarding any country, region, market, industry, investment or strategy. This information is intended for US residents only.
Disclosure: Interactive Brokers
Information posted on IBKR Campus that is provided by third-parties does NOT constitute a recommendation that you should contract for the services of that third party. Third-party participants who contribute to IBKR Campus are independent of Interactive Brokers and Interactive Brokers does not make any representations or warranties concerning the services offered, their past or future performance, or the accuracy of the information provided by the third party. Past performance is no guarantee of future results.
This material is from Investopedia and is being posted with its permission. The views expressed in this material are solely those of the author and/or Investopedia and Interactive Brokers is not endorsing or recommending any investment or trading discussed in the material. This material is not and should not be construed as an offer to buy or sell any security. It should not be construed as research or investment advice or a recommendation to buy, sell or hold any security or commodity. This material does not and is not intended to take into account the particular financial conditions, investment objectives or requirements of individual customers. Before acting on this material, you should consider whether it is suitable for your particular circumstances and, as necessary, seek professional advice.
Disclosure: ETFs
Any discussion or mention of an ETF is not to be construed as recommendation, promotion or solicitation. All investors should review and consider associated investment risks, charges and expenses of the investment company or fund prior to investing. Before acting on this material, you should consider whether it is suitable for your particular circumstances and, as necessary, seek professional advice.




Join The Conversation
If you have a general question, it may already be covered in our FAQs. If you have an account-specific question or concern, please reach out to Client Services.