


Investopedia is partnering with CMT Association on this newsletter. The contents of this newsletter are for informational and educational purposes only, however, and do not constitute investing advice. The guest authors, which may sell research to investors, and may trade or hold positions in securities mentioned herein do not represent the views of CMT Association or Investopedia. Please consult a financial advisor for investment recommendations and services.
1/ All Green Zone
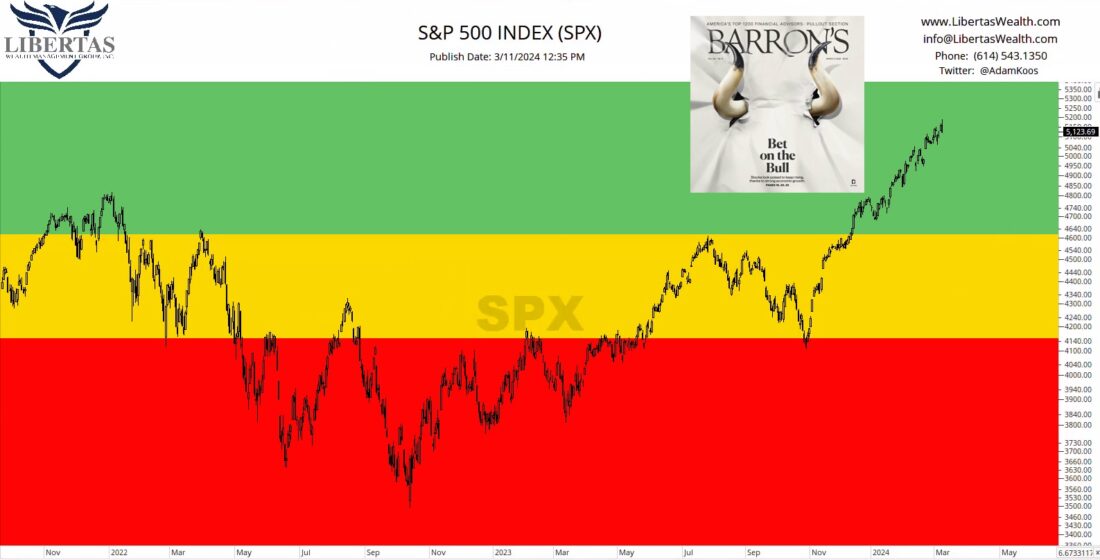
After spending more than two years in the danger and caution zones, our “Inverse Traffic Light” is signaling “all green” for the market at this juncture. Zones are created using support and resistance levels going back as far as early 2022.
While there is no arguing with this uptrend, it would make complete sense if the market digested some of the recent gains, pulling back to the 2021 highs, or even the spring ’22 and summer ’23 highs (marked by the top of the caution zone / bottom of the green zone).
However, while seasonality suggests tough times lie ahead over the course of the next several weeks, and while Barron’s magazine has printed a cover that could mark a short-term top in stocks (as a contrarian indicator), sideways digestion is also a possibility we need to keep in mind, as well.

Financial market research from professionals at the forefront of technical analysis innovation.
2/ Comparing Moving Averages
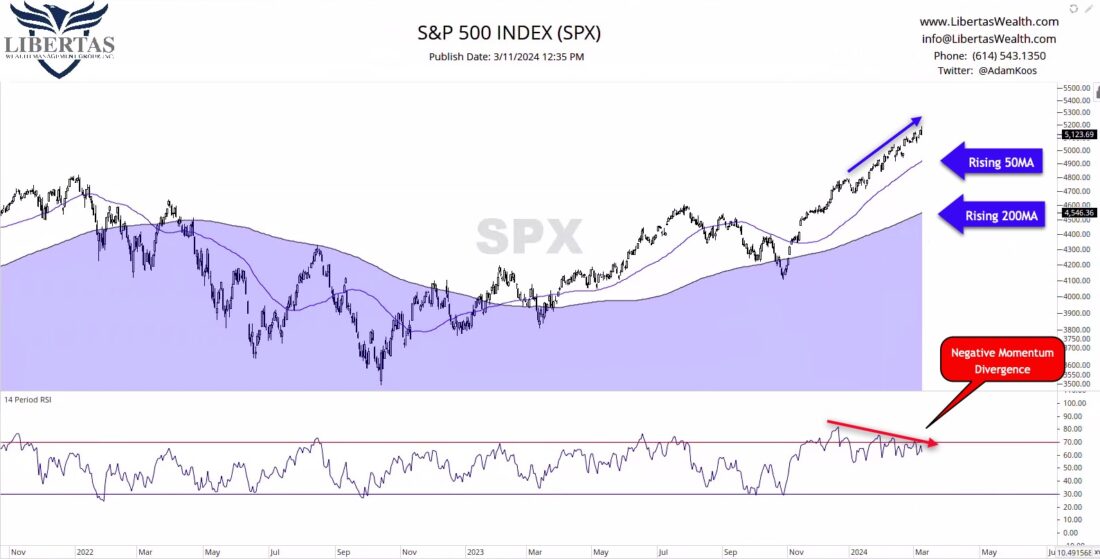
Looking at the S&P500 through a different lens, we can clearly see a rising 50MA and 200MA. Moving averages help to smooth out the choppiness in charts, and make it easier to determine what the current trend is (all depending on your timeframe).
One thing to keep in mind is that bottom pane in RSI, which is a momentum indicator. Whenever we see price rise (in the upper pane) and momentum falling, this is what we call a “negative momentum divergence.” It’s not a for-sure-thing, but price has a tendency to follow momentum, and since we’re seeing momentum falling (and especially since it’s topping out below 70), it’s another piece of evidence that stocks could be in for a pullback, or a “stall” at the bare mimimum.
3/ Technology Taste
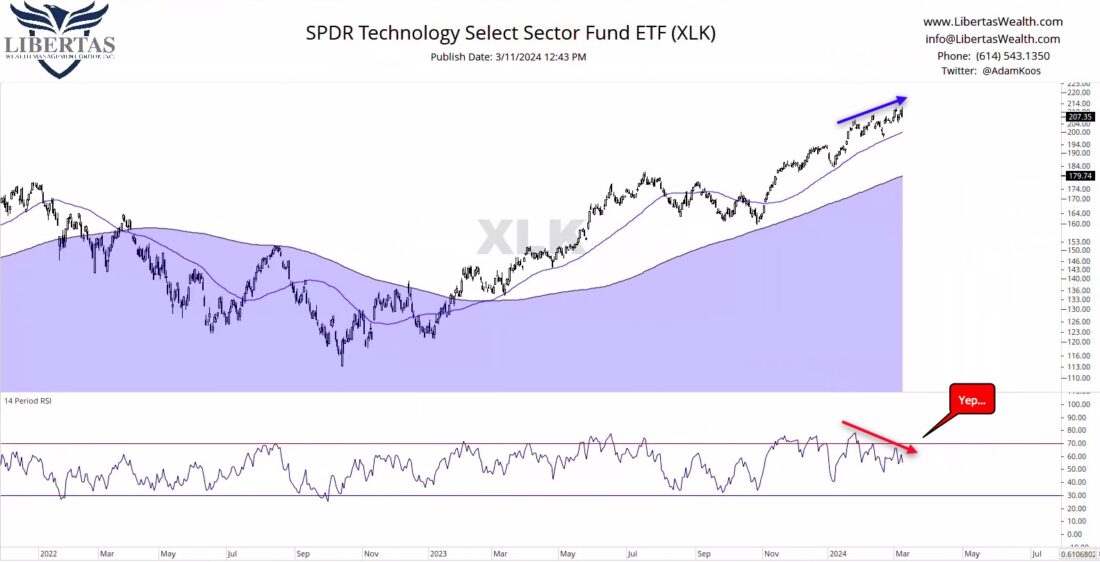
Since technology and A.I. have been at the focus of roughly every news program, commercial, and advertisement in your social media apps, I thought it would be interesting to check and see if we were seeing a similar negative divergence in momentum… and yep, like the old Prego commercials used to say, “It’s in there.”
Granted, like the overall market, technology is unequivocally in an uptrend. The big question is, like most stocks, “Are we in for a pause, given how well things have gone this past few months?”
Only time will tell, but if one thing is for certain, it rarely pays to be a “trend predictor.” Rather, I find that “trend following” is much easier on the emotions. Predicting (i.e., “guessing”) is almost never a great strategy!
4/ Small-Caps Rising
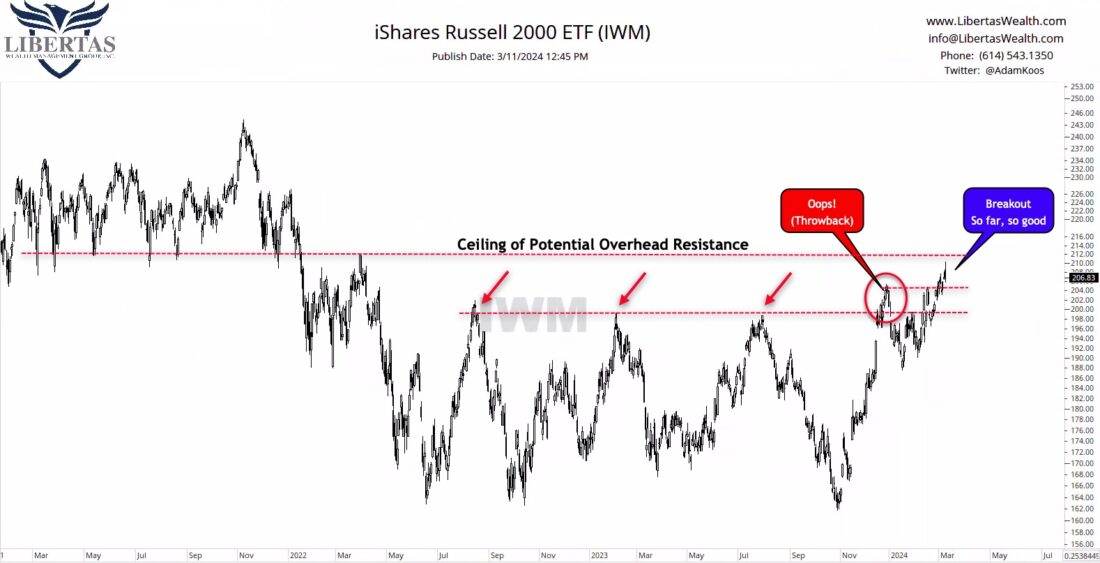
Lastly, I thought I’d peek under the Small-Cap hood, see what’s going on with these smaller companies, and what we discover here is good news! Unlike its large and mega-cap big brothers, small-caps have been struggling on a relative basis, ever since the bull market recovery began.
That is… until recently.
What you’re seeing in the chart above is first, a breakout that turned into a “fake out” (or more technically defined as a “throw back” below the line of overhead resistance marked by the red arrows).
However, after just a few weeks, and more importantly, a major higher-low, small-caps broke out above that former ceiling of resistance, as well as above the previous breakout high, so as the call-out above reads “so far, so good!”
That being said, there is another ceiling of potential overhead resistance as marked by the spring ’22 highs, and a peppering of former support going all the way back to 2021, so it wouldn’t surprise me to see some choppiness and digestion before small-caps break out any further.
—
Originally posted on March 12th 2024
Disclosure: Investopedia
Investopedia.com: The comments, opinions and analyses expressed herein are for informational purposes only and should not be considered individual investment advice or recommendations to invest in any security or to adopt any investment strategy. While we believe the information provided herein is reliable, we do not warrant its accuracy or completeness. The views and strategies described on our content may not be suitable for all investors. Because market and economic conditions are subject to rapid change, all comments, opinions and analyses contained within our content are rendered as of the date of the posting and may change without notice. The material is not intended as a complete analysis of every material fact regarding any country, region, market, industry, investment or strategy. This information is intended for US residents only.
Disclosure: Interactive Brokers
Information posted on IBKR Campus that is provided by third-parties does NOT constitute a recommendation that you should contract for the services of that third party. Third-party participants who contribute to IBKR Campus are independent of Interactive Brokers and Interactive Brokers does not make any representations or warranties concerning the services offered, their past or future performance, or the accuracy of the information provided by the third party. Past performance is no guarantee of future results.
This material is from Investopedia and is being posted with its permission. The views expressed in this material are solely those of the author and/or Investopedia and Interactive Brokers is not endorsing or recommending any investment or trading discussed in the material. This material is not and should not be construed as an offer to buy or sell any security. It should not be construed as research or investment advice or a recommendation to buy, sell or hold any security or commodity. This material does not and is not intended to take into account the particular financial conditions, investment objectives or requirements of individual customers. Before acting on this material, you should consider whether it is suitable for your particular circumstances and, as necessary, seek professional advice.
Disclosure: ETFs
Any discussion or mention of an ETF is not to be construed as recommendation, promotion or solicitation. All investors should review and consider associated investment risks, charges and expenses of the investment company or fund prior to investing. Before acting on this material, you should consider whether it is suitable for your particular circumstances and, as necessary, seek professional advice.


Join The Conversation
If you have a general question, it may already be covered in our FAQs. If you have an account-specific question or concern, please reach out to Client Services.