


Investopedia is partnering with CMT Association on this newsletter. The contents of this newsletter are for informational and educational purposes only, however, and do not constitute investing advice. The guest authors, which may sell research to investors, and may trade or hold positions in securities mentioned herein do not represent the views of CMT Association or Investopedia. Please consult a financial advisor for investment recommendations and services.
1/ History Repeats
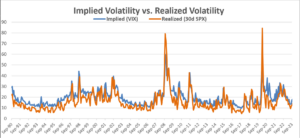
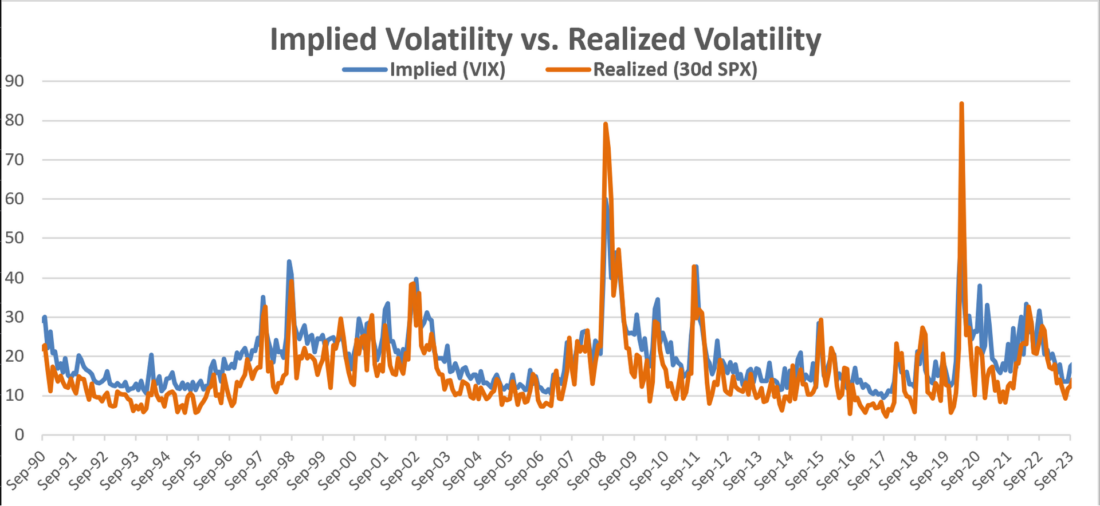
Given the rise of options trading volumes in recent years I think it is important to understand how options can be used to help traders make better informed decisions. Markets are not as efficient as most believe. A visual representation of this concept is easily explained when you compare Implied Volatility with Historical Volatility.
To compare this relationship, we will look at the Cboe VIX Volatility Index (VIX), a measurement of expected volatility 30 days forward using weighted prices of S&P 500 Index (SPX) calls and puts over a range of strike prices, compared to historical or realized volatility in the S&P 500 (SPX). To simply put it we will look at the volatility the options market has priced into the market versus the volatility that occurred. This relationship is positive 86.5% of the time on a monthly basis since the early 90’s.
Historically market participants overpay for option premiums. These inefficiencies in the options market allow for opportunities to exploit the difference between what is expected to happen and what does happen in the market. This means the buyers of options generally overpay because their expectations are greater than reality. The spread between implied volatility and historical volatility is known as volatility risk premium (VRP). Traders who take advantage of this inefficiency are known as VRP Farmers, except we don’t wear bibs or drive tractors.
2/ ABNB: Sleep Easier
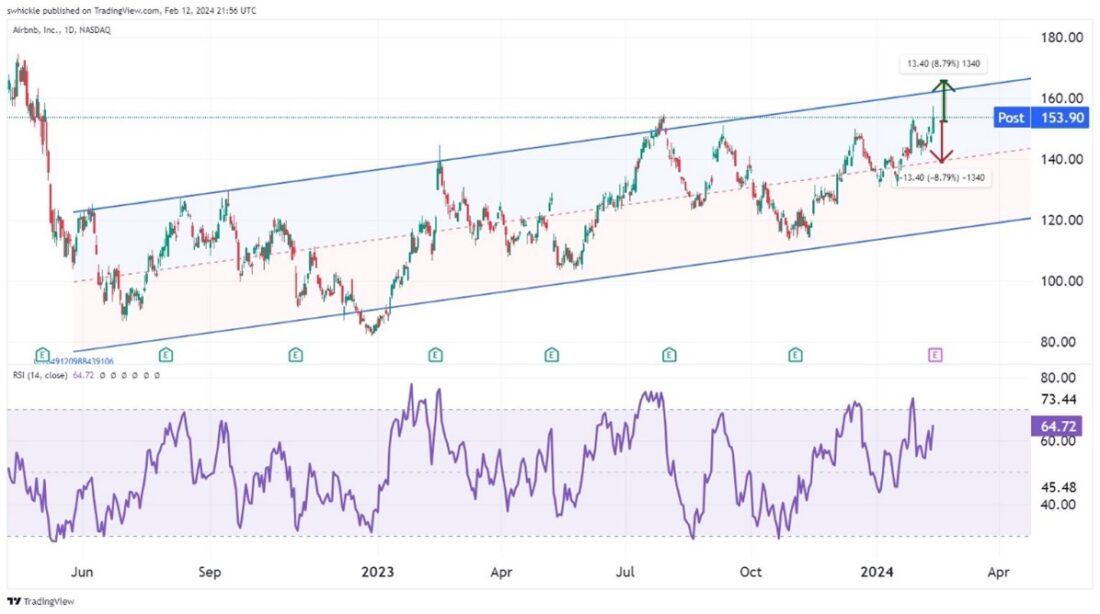
Today after the close Air BNB (ABNB) reports earnings so let’s break it down. As far as earnings go, I have no idea where they will fall. From the chart we can see using the Linear Regression Channel tells us that ABNB has been trending up from the December 2022 lows. Considering the Relative Strength Index is nearing overbought territory with a reading of 64 the positive price action be getting a little over done. Each time in the past it has moved into or very near this level it has reversed course and moved counter to the primary trend. The previous 7 earnings cycles have produced a mixed bag of market reactions with both positive and negative moves post report.
With ABNB closing at $153.80 I will now turn to the options market to see what it is implying the expected move in ABNB will be. We will look at the cost of buying an at the money straddle. Buying an at the money straddle would entail buying a call and put with a strike price closest to the last trading price of the stock. Choose an expiration date closest to, but after the expected event.
In this case we are looking at an ABNB Feb 16, 2024 $152.50 straddle. The ask price is $13.40 as of the close on Monday 2.12.2024. Remember, most traders who purchase options pay a premium based on what they expect to happen, but a considerable percentage of the time they are wrong. Buying a straddle is a non- directional trade. It does not matter if the stock moves up or down, it just needs to move in a way, up or down, that is greater than the premium paid by expiration to be profitable.
If the options market is correct the stock will move around $13.40 (8.7%) or less post earnings. We don’t know which direction, but we can add it to the chart to help visualize the expected move. Keep in mind this method is not always a precise measurement as the market can and will get it wrong periodically, but it is a reasonably fair way to access the expected move. This is just another tool that can help a trader manage risk as they can adjust orders or positions accordingly.
3/ Dr. Dr. Give Me the News
When you are sick you should go to the doctor. With the S&P 500 (SPX) near or in overbought conditions depending on how you gauge it, I thought it was time to make an appointment. The old saying goes, Dr Copper has a PHD in economics if that is the case, he is certainly smarter to me. So, what is he saying?
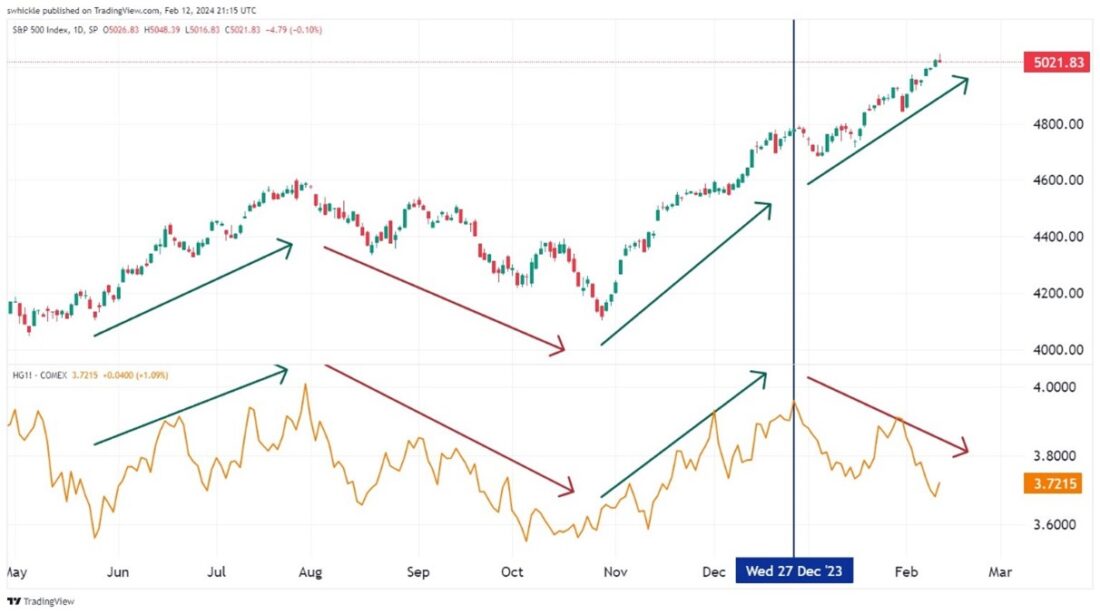
Year to date the S&P 500 has been running higher and is up 5.4% YTD. Copper has been struggling this year and is moving counter to the market trend. Copper, given its wide-reaching industrial use, can be used as a proxy for overall economic activity.
When we compare the price action of copper to the price action of the S&P 500 (SPX) we would generally expect them to have a positive correlation. If the demand for copper (reflected through price) disconnects with the trend of the market it is worth taking a second look.
In this chart the S&P 500 (SPX) and HG copper had a relatively positive correlation for much of 2023. That all changed in late 2023 when the price action of copper diverges from the price action of the market and began making multi-month lows while the market pushes through all-time highs. Generally, this is not considered a good thing. It may indicate a weakness forming in industrial demand.
If conditions continue to diverge and, or, other cracks in the markets begin to form, it may be better to get your medicine early from Dr. Copper rather than catching a cold market.
—
Originally posted February 13th 2024
Disclosure: Investopedia
Investopedia.com: The comments, opinions and analyses expressed herein are for informational purposes only and should not be considered individual investment advice or recommendations to invest in any security or to adopt any investment strategy. While we believe the information provided herein is reliable, we do not warrant its accuracy or completeness. The views and strategies described on our content may not be suitable for all investors. Because market and economic conditions are subject to rapid change, all comments, opinions and analyses contained within our content are rendered as of the date of the posting and may change without notice. The material is not intended as a complete analysis of every material fact regarding any country, region, market, industry, investment or strategy. This information is intended for US residents only.
Disclosure: Interactive Brokers
Information posted on IBKR Campus that is provided by third-parties does NOT constitute a recommendation that you should contract for the services of that third party. Third-party participants who contribute to IBKR Campus are independent of Interactive Brokers and Interactive Brokers does not make any representations or warranties concerning the services offered, their past or future performance, or the accuracy of the information provided by the third party. Past performance is no guarantee of future results.
This material is from Investopedia and is being posted with its permission. The views expressed in this material are solely those of the author and/or Investopedia and Interactive Brokers is not endorsing or recommending any investment or trading discussed in the material. This material is not and should not be construed as an offer to buy or sell any security. It should not be construed as research or investment advice or a recommendation to buy, sell or hold any security or commodity. This material does not and is not intended to take into account the particular financial conditions, investment objectives or requirements of individual customers. Before acting on this material, you should consider whether it is suitable for your particular circumstances and, as necessary, seek professional advice.
Disclosure: Options Trading
Options involve risk and are not suitable for all investors. Multiple leg strategies, including spreads, will incur multiple commission charges. For more information read the "Characteristics and Risks of Standardized Options" also known as the options disclosure document (ODD) or visit ibkr.com/occ
Disclosure: Futures Trading
Futures are not suitable for all investors. The amount you may lose may be greater than your initial investment. Before trading futures, please read the CFTC Risk Disclosure. A copy and additional information are available at ibkr.com.


Join The Conversation
If you have a general question, it may already be covered in our FAQs. If you have an account-specific question or concern, please reach out to Client Services.