


By Alex Cole
1/ Three simple questions
2/ GoNoGo and Treasury Rates
3/ GoNoGo and the Dollar
4/ GoNoGo and Oil
5/ GoNoGo and Gold
6/ GoNoGo and Bitcoin
Investopedia is partnering with CMT Association on this newsletter. The contents of this newsletter are for informational and educational purposes only, however, and do not constitute investing advice. The guest authors, which may sell research to investors, and may trade or hold positions in securities mentioned herein do not represent the views of CMT Association or Investopedia. Please consult a financial advisor for investment recommendations and services.
1/ Three Simple Questions
In earlier articles this week, (1, 2, 3, 4) we have spent time building a disciplined checklist of technical analysis that will help us objectively understand the technical environment for any security over any timeframe. Using GoNoGo Charts, we have been able to keep this process simple, allowing us to focus on price and remove the confusion and doubt that comes with analysis paralysis.
It’s important to note at this time, for those wondering about the changing color of the oscillator line, that we incorporate a sense of volume analysis into our work. When the GoNoGo Oscillator is darker blue, we know that volume is higher than an historical average. From the prior articles, and using GoNoGo Trend, GoNoGo Oscillator, and GoNoGo Squeeze, we will have an understanding of trend, momentum, volume, and volatility.
We will spend today’s time applying the GoNoGo Charts to a broad range of markets to answer three simple questions.
- What is the status of the trend?
- Where is the GoNoGo Oscillator?
- Is there anything important happening at the zero line?
If we can answer these questions, we will have a complete overview of the technical analysis of a security at any given time. Let’s look at the chart below of the SPY and answer those 3 questions.
- GoNoGo Trend tells us that using our checklist for trend identification calculated behind the scenes, the trend is a strong “Go” (bright blue bar).
- The oscillator is at a value of 4, meaning momentum is in positive territory confirming the trend, and no longer overbought.
- Since breaking above the zero line in advance of the “Go” trend, the oscillator has not yet been back to test that level.
We can also see, because the price panel is free from clutter, that there is a Go Countertrend Correction Icon (red arrow) near resistance from prior highs.

2/ GoNoGo and Treasury Rates
The second chart is a chart of 10 year treasury rates (TNX). We know that rising or falling rates can impact equity prices. Let’s take a shot at answering our three questions. As a reminder, they are:
- What is the status of the trend?
- Where is the GoNoGo Oscillator?
- Is there anything important happening at the zero line?
Now the answers:
- The trend is a strong “NoGo” with the indicator painting purple bars as price makes a new low.
- GoNoGo Oscillator is at negative 3, confirming the “NoGo” trend in price
- After falling into negative territory, GoNoGo Oscillator rallied to test the zero line from below as GoNoGo Trend painted an amber “Go Fish” bar. It was turned away, telling us that momentum is resurgent in the direction of the “NoGo”

3/ GoNoGo and the Dollar
A strong U.S. dollar can act as a headwind for equities. We have had a strong dollar since the summer. However, we saw bearish divergence between price making higher highs and GoNoGo Oscillator making lower highs over the last month. And when the oscillator failed to find support at the zero line, GoNoGo Trend was unable to hold onto “Go” colors with a couple of amber “Go Fish” bars creeping into the mix before the trend changed to “NoGo”. Where are we now? Let’s answer our three questions:
- What is the status of the trend?
- Where is the GoNoGo Oscillator?
- Is there anything important happening at the zero line?
- The calculation of GoNoGo Trend behind the scenes tells us that the “NoGo” is strong as it paints purple bars.
- GoNoGo Oscillator is in negative territory but not oversold, at a value of -3
- As price broke below horizontal support and entered a “NoGo” trend, GoNoGo Oscillator was rejected by the zero line, indicating surging negative momentum helping price hit a new low.

4/ GoNoGo and Oil
The price of oil (USO) can have a significant macroeconomic impact on global economies and equity prices around the world. After exhibiting some chop during the month of October a trend seems to have been established. Could we give a competent technical overview of oil prices to a client in the industry? Here are the three questions again:
- What is the status of the trend?
- Where is the GoNoGo Oscillator?
- Is there anything important happening at the zero line?
- GoNoGo Trend tells us that using a weight of the evidence approach the trend is a strong “NoGo” with the indicator painting purple bars.
- Momentum is in negative territory with GoNoGo Oscillator at a value of negative 3. Not yet oversold, momentum is in line with the trend in price.
- We saw a NoGo Countertrend Correction Icon (green arrow) after the last low, and price did indeed rally with GoNoGo Trend painting weaker pink bars. At the same time, GoNoGo Oscillator rose to test the zero line from below where it was rejected a bar ago, indicating NoGo Trend Continuation (red circle).

5/ GoNoGo and Gold
Many expected gold (we are using the ETF GLD) to act as a flight to safety during the equity “NoGo” trend we saw from early August. But gold has confounded investors before and it will again, and has moved arguably more inline with equities than not this year. What do the technicals say about gold now?
- What is the status of the trend?
- Where is the GoNoGo Oscillator?
- Is there anything important happening at the zero line?
- GoNoGo Trend shows that gold has seen the “Go” trend strengthen of late to once again paint strong blue bars.
- GoNoGo Oscillator is riding the zero line, which tells us there is little directional momentum and a potential tug of war between buyers and sellers.
- With the GoNoGo Oscillator at zero for a second bar, we see the very beginning of a GoNoGo Squeeze and we will watch to see in which direction it resolves. We know that for the “Go” trend to remain healthy, the oscillator must recapture positive territory so that momentum is on the side of the “Go” trend. Failure here at zero, would signal trouble for the “Go” trend in price.

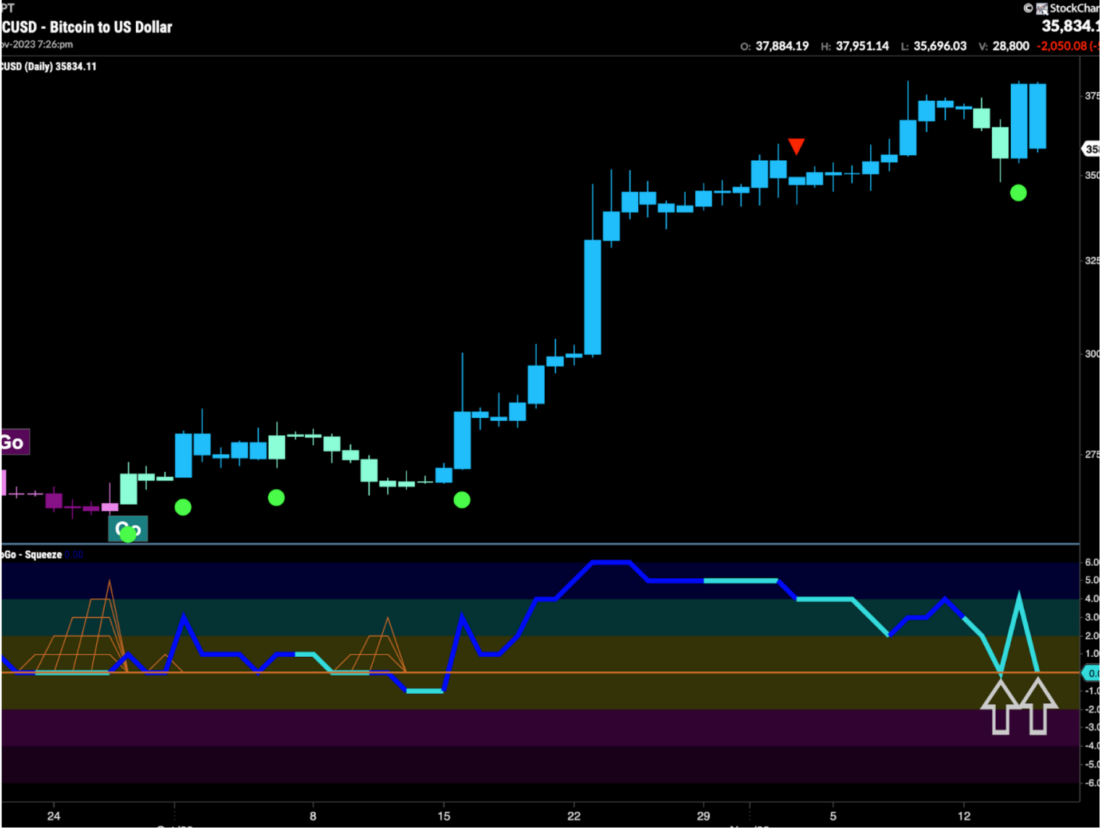
6/ GoNoGo and Bitcoin
The last chart for today takes a look at the world’s largest crypto currency through the GoNoGo lens (BTCUSD). An economic bubble or the future of financial transactions? Of course, we aren’t here for opinions but to give an objective overview of the technical analysis. Right now, what do GoNoGo Charts say about bitcoin price?
- What is the status of the trend?
- Where is the GoNoGo Oscillator?
- Is there anything important happening at the zero line?
- GoNoGo Trend tells us that using our trend identification checklist the trend is a strong “Go” with bright blue bars as price closes in on 38,000.
- GoNoGo Oscillator is at zero, suggesting that all of the blended momentum inputs are in their neutral territory.
- With the oscillator at zero, we will watch to see if it finds support, as we know it should in a healthy “Go” trend. If it does, and rallies back into positive territory we will see another Go Trend Continuation Icon (green circle) and can expect price to make an attempt at new highs.
—
Originally posted 17th November 2023
Join The Conversation
If you have a general question, it may already be covered in our FAQs. If you have an account-specific question or concern, please reach out to Client Services.
Leave a Reply
Disclosure: Investopedia
Investopedia.com: The comments, opinions and analyses expressed herein are for informational purposes only and should not be considered individual investment advice or recommendations to invest in any security or to adopt any investment strategy. While we believe the information provided herein is reliable, we do not warrant its accuracy or completeness. The views and strategies described on our content may not be suitable for all investors. Because market and economic conditions are subject to rapid change, all comments, opinions and analyses contained within our content are rendered as of the date of the posting and may change without notice. The material is not intended as a complete analysis of every material fact regarding any country, region, market, industry, investment or strategy. This information is intended for US residents only.
Disclosure: Interactive Brokers
Information posted on IBKR Campus that is provided by third-parties does NOT constitute a recommendation that you should contract for the services of that third party. Third-party participants who contribute to IBKR Campus are independent of Interactive Brokers and Interactive Brokers does not make any representations or warranties concerning the services offered, their past or future performance, or the accuracy of the information provided by the third party. Past performance is no guarantee of future results.
This material is from Investopedia and is being posted with its permission. The views expressed in this material are solely those of the author and/or Investopedia and Interactive Brokers is not endorsing or recommending any investment or trading discussed in the material. This material is not and should not be construed as an offer to buy or sell any security. It should not be construed as research or investment advice or a recommendation to buy, sell or hold any security or commodity. This material does not and is not intended to take into account the particular financial conditions, investment objectives or requirements of individual customers. Before acting on this material, you should consider whether it is suitable for your particular circumstances and, as necessary, seek professional advice.
Disclosure: Forex
There is a substantial risk of loss in foreign exchange trading. The settlement date of foreign exchange trades can vary due to time zone differences and bank holidays. When trading across foreign exchange markets, this may necessitate borrowing funds to settle foreign exchange trades. The interest rate on borrowed funds must be considered when computing the cost of trades across multiple markets.
Disclosure: ETFs
Any discussion or mention of an ETF is not to be construed as recommendation, promotion or solicitation. All investors should review and consider associated investment risks, charges and expenses of the investment company or fund prior to investing. Before acting on this material, you should consider whether it is suitable for your particular circumstances and, as necessary, seek professional advice.
Disclosure: Digital Assets
Trading in digital assets, including cryptocurrencies, is especially risky and is only for individuals with a high risk tolerance and the financial ability to sustain losses. Eligibility to trade in digital asset products may vary based on jurisdiction.


excellent detail and analysis. thank you
Nothing makes us happier than satisfied readers!