


Investopedia is partnering with CMT Association on this newsletter. The contents of this newsletter are for informational and educational purposes only, however, and do not constitute investing advice. The guest authors, which may sell research to investors, and may trade or hold positions in securities mentioned herein do not represent the views of CMT Association or Investopedia. Please consult a financial advisor for investment recommendations and services.
1/ CVS Looking Healthy
In Yesterday’s post, I mentioned that one of the most important rules we adhere to as Technical Analysts is to make sure that we know and follow the Primary Trend. My own worst trading performance was in 2009 when I was convinced the market would fall but the Primary Trend was going higher. If only I’d done the CMT before then!
We’ve all looked at ATRs in terms of stop losses. Ie. When price falls by more than 1 ATR (the normal daily volatility) we conclude that the trend has changed—since the move is not greater than the typical volatility—and we exit the trade.
In the early 90’s, Michael Gur wrote a book called “The Symmetry Wave Trading Method” and the general crux was constructing “swings” using multiple ATRs as the trigger for a change in direction.
A Swing chart/overlay is an awesome way to determine trend. There are only two options (up or down). There are many calculations that we can use for swings to determine the direction. From points or percent retraced through to bar relationships as introduced by WD Gann. No matter how they are calculated, we can use them as our guide to only trade with the Primary Trend.
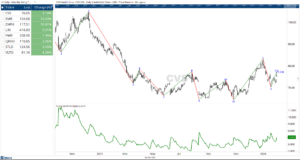
In Chart 1, I’ve scanned the S&P500 for any names that have turned to an uptrend in the last day (Feb 8 data) using a 4-ATR Volatility Swing. The list is short with only a few names—which make it easy for us to examine them. Using Feb 7’s data (when I wrote this) CVS showed up and it is really interesting.
If you look at the bottom of the chart where there is an “11” label, you will see that a new regime of upward trends has started. The “11” tells us that there had been 11 successive lower swing lows without a higher swing high. The “1” on the next swing higher (after 11) tells us that we made a new swing high and have started a new count in the opposite direction.
In this environment, we just got a signal that Swing 2 is set (because the market retraced enough from 2) and we have a Potential wave 3.
Right now, you may be thinking “CVS didn’t just turn. The swing bottom was at 2!” That’s a confusing part of how these swings are drawn. It is not until price retraced by 4 ATRs that we add that last swing at all. Since Jan 25, the average 4 ATR value was 6.5, and given the low at “2” was around $70, CVS had to climb above $76.50 before we could add the swing. That happened on Feb 7th.
While the aggressive traders may take this signal right now with a stop at “2”, the more conservative approach would be to wait for CVS to post a newer high above “1” ($83.25). Either way, Swings provide an interesting way to determine the trend in the market – something we all need to be able to do.

2/ BTC against Resistance Levels
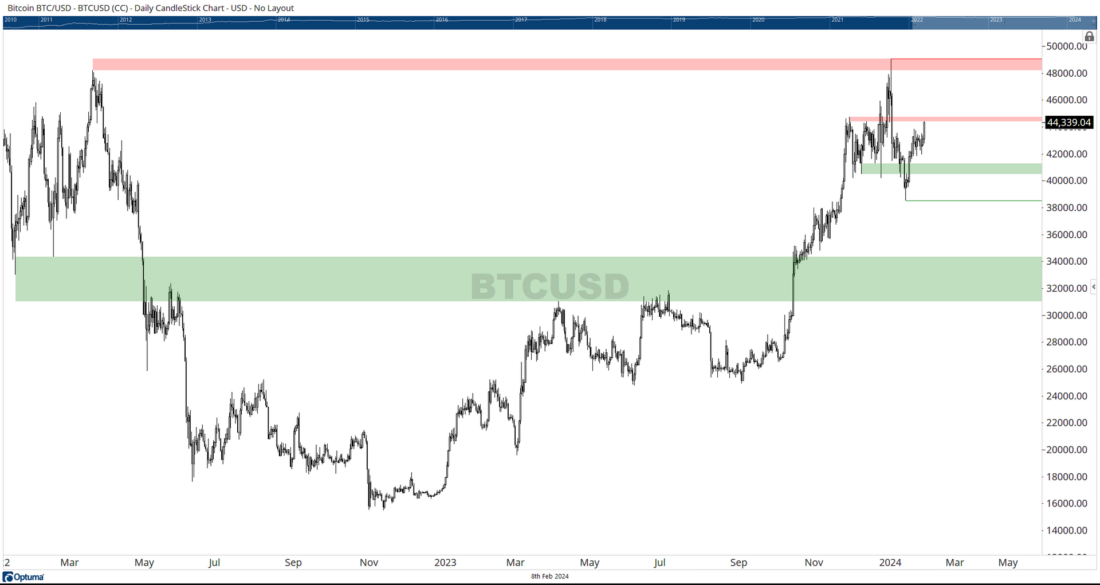
Despite the recent pullback over the past month, Bitcoin is once again pushing up against resistance levels and with the momentum it has, it’s likely to push through and reach the next major resistance level at 48,208. Of course, with all Resistance zone, I’d prefer to see a close above resistance rather than an intraday penetration of the zone.
The general trend of the where BTC has been going since November 2023 tells us that the Primary Trend is up, and we see a series of higher highs and higher lows with string support at 24,000.
On Chart 2 I’ve added a Support and Resistance Finder indicator that helps me identify where we can expect to find Support and Resistance.
3/ BTC with Volatility S&R
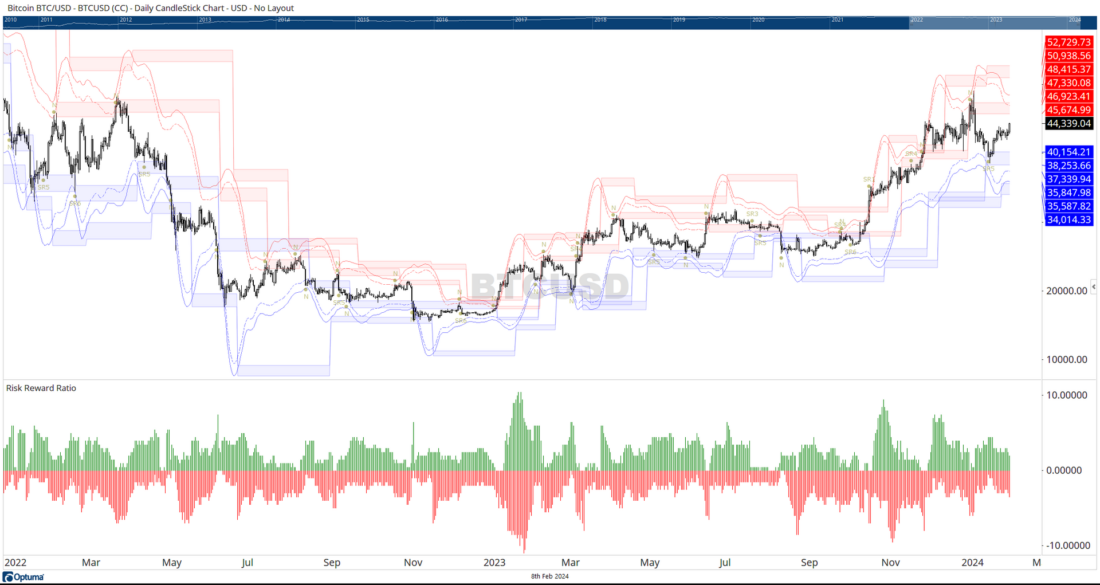
Another way of looking at Support and Resistance is to use an Indicator created by Kirk Northington, CMT and Carson Dahlberg, CMT called Volatility Based Support and Resistance (VBSR).
The math behind this one is crazy complex, but the results are an amazing indicator that shows where we can expect to find support and resistance based on volatility. There is a working paper available at https://www.optuma.com/research that explains more about VBSR.
In Chart 3 you can see the same period of BTC as Chart 2 but with VBSR added. There’s a lot of lines but take some time to look back over the history and see how many times the price stalled and often reversed at these zones.
I love that there is still innovation in the area of Technical Analysis, and this is a fantastic example of an indicator that leverages the power of computers to do analysis in seconds that would have been impossible 20 years ago.
In the bottom panel we measure the distance from Price to the next support or Resistance level so we can visualize the potential risk and reward at any point in time. When price is resting again support but there is a long way to go before we hit resistance, we will see very little red and a lot of green. Eg. The Middle of December 2023 is an example.
4/ Consumer Discretionary and Money Supply
For my final chart of the week, I’m heading back to an interesting correlation that is showing me strength in the market. The top panel in Chart 4 shows USA Money Supply (M1). This is the combined total of physical currency in circulation (M0) plus liquid funds in bank accounts. Can you guess when Covid handouts were distributed?
The second panel in Chart 4 shows the Consumer Discretionary Sector ETF (XLY). This is the sector that is most sensitive to confidence. What jumps out to me is how Consumer Discretionary had its steepest period of growth in conjunction with the handouts.
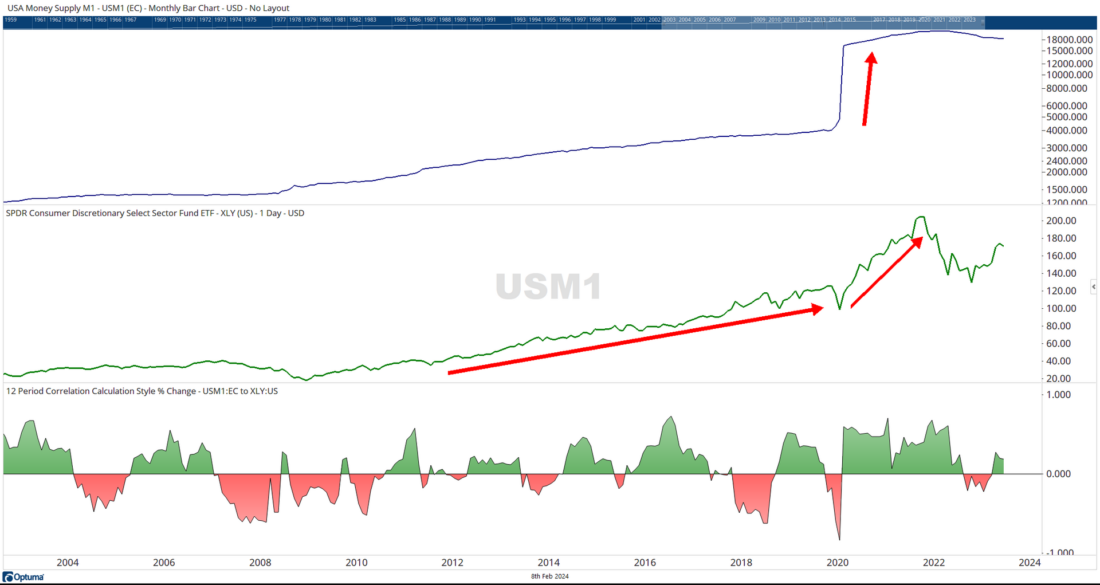
The next thing that jumps out is that as soon as the M1 supply started to fall from early 2022, the XLY had its most significant correction since the 2008 Financial Crisis.
You can see the correlation between the two in the third pane on the chart. Note: Don’t let anyone tell you that correlations are immutable—they’re not. All our research has shown that there is a cycling in correlations.
If we look at the most recent period of the chart, we can see some encouraging signs. M1 supply is still being reduced but XLY is now growing in spite of that. The correlations are a lot lower. This is very encouraging and shows considerable strength and confidence in the market.
—
Originally posted February 9th 2024
Disclosure: Investopedia
Investopedia.com: The comments, opinions and analyses expressed herein are for informational purposes only and should not be considered individual investment advice or recommendations to invest in any security or to adopt any investment strategy. While we believe the information provided herein is reliable, we do not warrant its accuracy or completeness. The views and strategies described on our content may not be suitable for all investors. Because market and economic conditions are subject to rapid change, all comments, opinions and analyses contained within our content are rendered as of the date of the posting and may change without notice. The material is not intended as a complete analysis of every material fact regarding any country, region, market, industry, investment or strategy. This information is intended for US residents only.
Disclosure: Interactive Brokers
Information posted on IBKR Campus that is provided by third-parties does NOT constitute a recommendation that you should contract for the services of that third party. Third-party participants who contribute to IBKR Campus are independent of Interactive Brokers and Interactive Brokers does not make any representations or warranties concerning the services offered, their past or future performance, or the accuracy of the information provided by the third party. Past performance is no guarantee of future results.
This material is from Investopedia and is being posted with its permission. The views expressed in this material are solely those of the author and/or Investopedia and Interactive Brokers is not endorsing or recommending any investment or trading discussed in the material. This material is not and should not be construed as an offer to buy or sell any security. It should not be construed as research or investment advice or a recommendation to buy, sell or hold any security or commodity. This material does not and is not intended to take into account the particular financial conditions, investment objectives or requirements of individual customers. Before acting on this material, you should consider whether it is suitable for your particular circumstances and, as necessary, seek professional advice.
Disclosure: ETFs
Any discussion or mention of an ETF is not to be construed as recommendation, promotion or solicitation. All investors should review and consider associated investment risks, charges and expenses of the investment company or fund prior to investing. Before acting on this material, you should consider whether it is suitable for your particular circumstances and, as necessary, seek professional advice.
Disclosure: Digital Assets
Trading in digital assets, including cryptocurrencies, is especially risky and is only for individuals with a high risk tolerance and the financial ability to sustain losses. Eligibility to trade in digital asset products may vary based on jurisdiction.


Join The Conversation
If you have a general question, it may already be covered in our FAQs. If you have an account-specific question or concern, please reach out to Client Services.