


By J.C. Parets & All Star Charts
Monday 31st May, 2023
1/ Falling Commodities Could Suggest Lower Rates
2/ Is Tech Extended?
3/ Big Levels for the Broader Market
4/ Markets Trend
Investopedia is partnering with All Star Charts on this newsletter, which both sells its research to investors, and may trade or hold positions in securities mentioned herein. The contents of this newsletter are for informational and educational purposes only, however, and do not constitute investing advice.
1/ Falling Commodities Could Suggest Lower Rates
Commodities are breaking down to fresh lows as interest rates chop sideways. And it’s not only the high-profile contracts such as copper or crude.
We’re also witnessing broad weakness at the index level.
Check out the dual pane chart of the CRB Index and our equal-weight commodity index, consisting of 33 individual contracts:
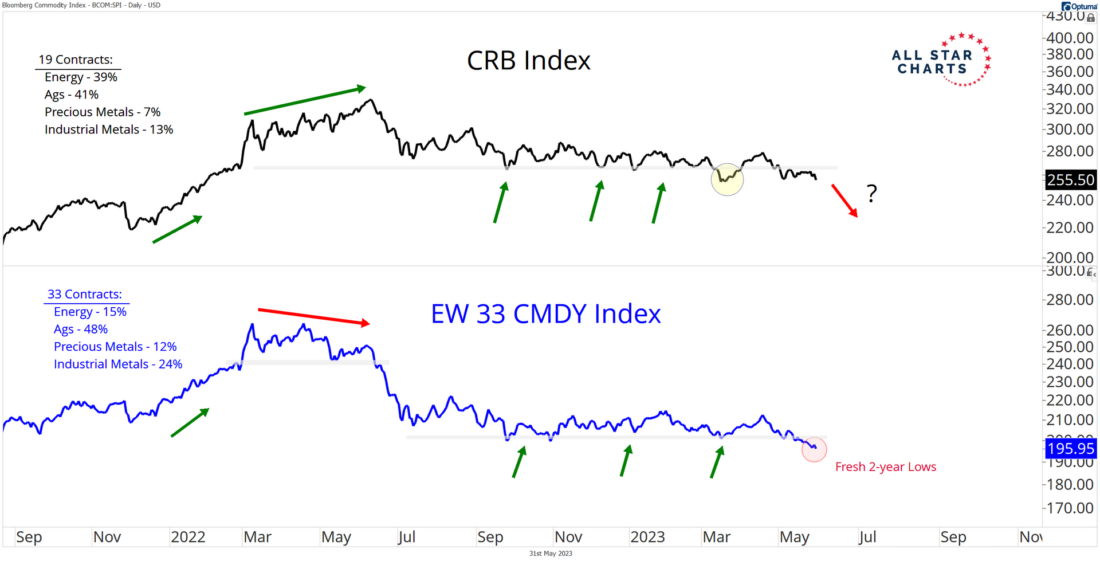
Despite the increased selling pressure in crude oil futures, the energy-heavy CRB Index remains somewhat buoyant, though vulnerable.
On the other hand, our equal-weight index is printing fresh two-year lows. Those fresh lows reveal a weakness beneath the surface, suggesting that the CRB Index and crude could follow to the downside.
If and when these indexes decisively resolve lower, we can add this to the long list of evidence supporting lower interest rates.
2/ Is Tech Extended?
The Nasdaq 100 (QQQ) hit fresh multi-year lows on a closing basis during the last week of 2022. Fast forward to today, and this major growth index is up more than 30% from those lows.
The point here is that the Nasdaq has come a long way in just a short period of time. Naturally, many investors are wondering if the current rally is extended and may be due for a breather.
One way we can analyze whether or not a trend is overdone is simply by measuring the distance between current prices and the long-term mean:
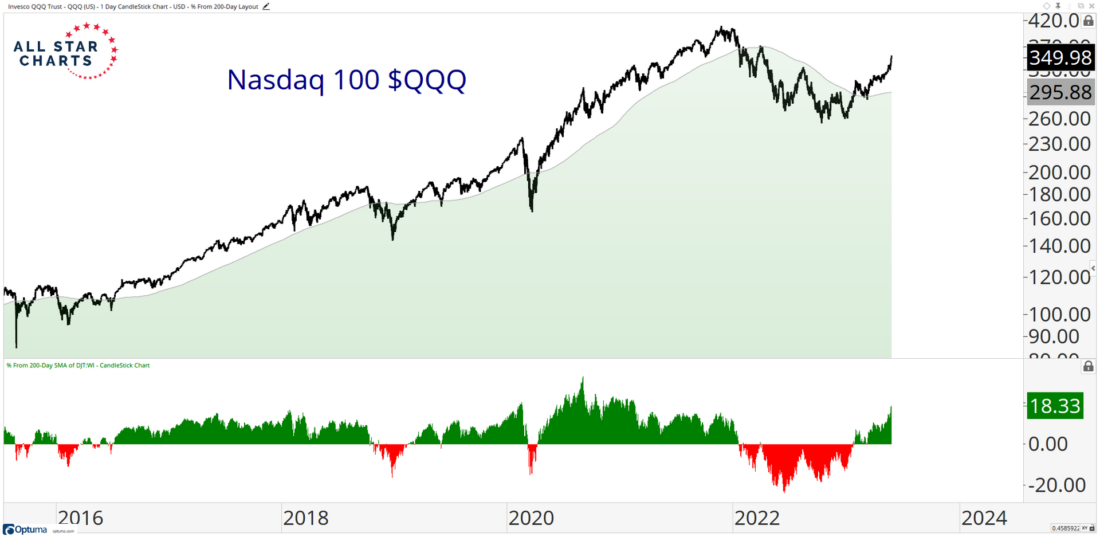
In the chart above, we’re looking at QQQ in the top pane along with its percentage from the 200-day moving average in the lower pane.
While the current uptrend pales in comparison to periods from the late 1990s just before the dotcom bubble, it does represent an extreme when compared to more recent history.
While there were about two quarters in late 2020 and early 2021 where price was more extended than it is today, we’re more interested in comparing the current period to the bull market in 2017.
The year of 2017 was one of the best ever for the U.S. stock market. It was also one of the least volatile. We think it is worth noting that the current trend is more extended than at any time during 2017. We could see some corrective action in the coming weeks.
3/ Big Levels for the Broader Market
When it comes to the laggard areas of the market, we wonder how these will react if the leaders take a breath.
The Vanguard Extended Market Index Fund (VXF) illustrates this theme, as it is constructed by removing the S&P 500 companies from the S&P Total Market Index, making it an excellent indicator of how the overall market is doing.
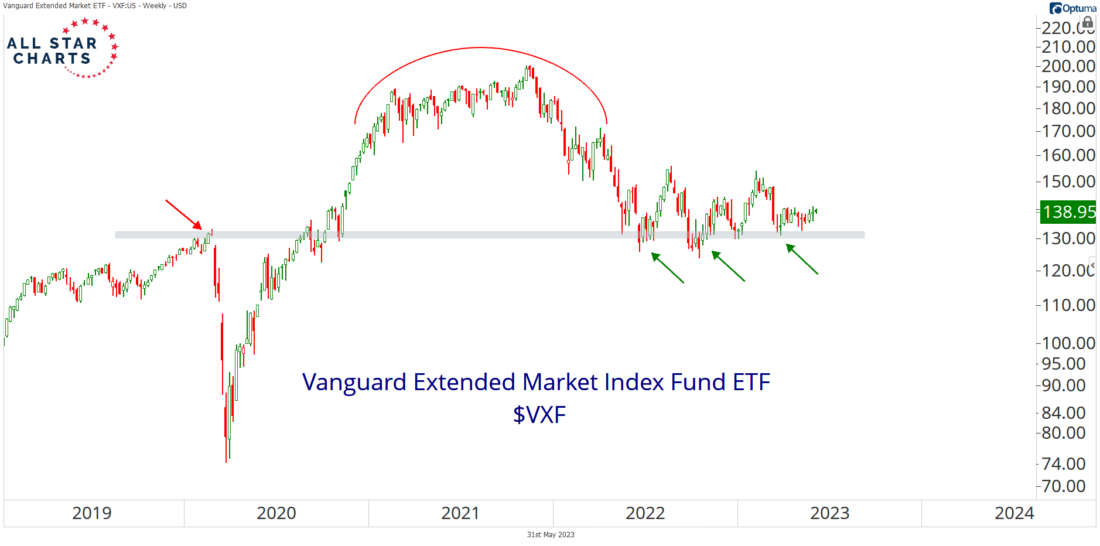
As you can see in the chart, the price is currently challenging a polarity zone that coincides with the pre-COVID highs and former lows from last year.
With so much price memory here, this is a logical level for VXF to resurge to the upside. However, a downside resolution would result in severe damage to the trend and bring on further selling pressure.
4/ Markets Trend
Markets trend. This is a key principle of Dow Theory and a foundational premise of technical analysis.
Regardless of asset class, this underlying fact presents itself time and again.
Here’s the daily chart of Chicago wheat revealing a clear downtrend:
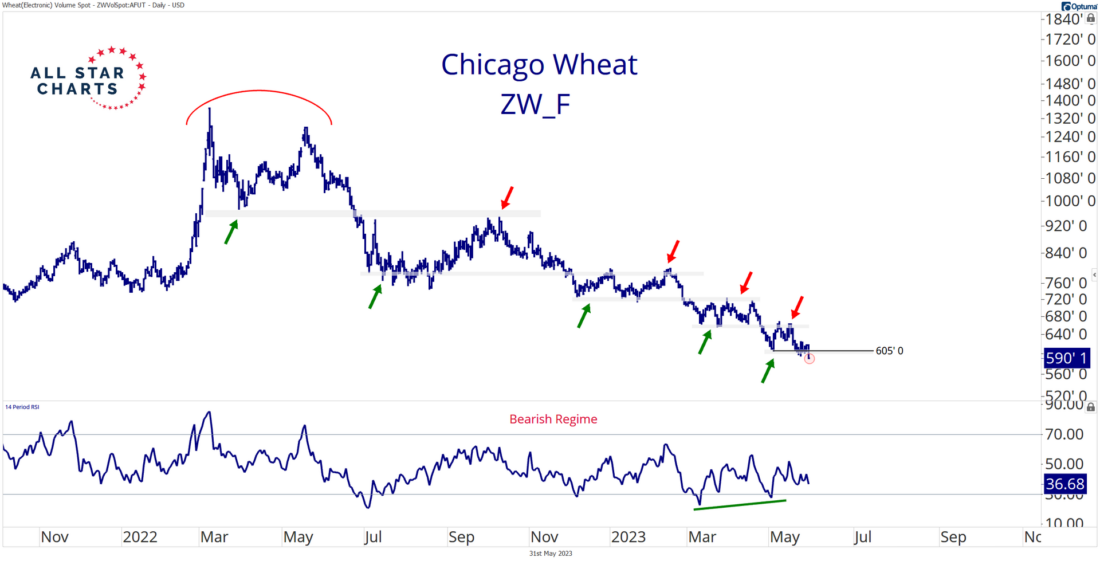
Momentum is oscillating within a bearish regime as price has steadily fallen for almost a year. In the process, price has stair-stepped lower, completing one bearish continuation pattern after another.
This is a great example of why we often err in the direction of the underlying trend, as most consolidations are continuation in nature.
Remember another critical Dow Theory component—trends persist.
Chicago wheat also provides an excellent example of most commodities charts these days. Weakness is spreading among these inflationary assets as sparse pockets of strength become increasingly difficult to find.
—
Originally posted 31st May 2023
Disclosure: Investopedia
Investopedia.com: The comments, opinions and analyses expressed herein are for informational purposes only and should not be considered individual investment advice or recommendations to invest in any security or to adopt any investment strategy. While we believe the information provided herein is reliable, we do not warrant its accuracy or completeness. The views and strategies described on our content may not be suitable for all investors. Because market and economic conditions are subject to rapid change, all comments, opinions and analyses contained within our content are rendered as of the date of the posting and may change without notice. The material is not intended as a complete analysis of every material fact regarding any country, region, market, industry, investment or strategy. This information is intended for US residents only.
Disclosure: Interactive Brokers
Information posted on IBKR Campus that is provided by third-parties does NOT constitute a recommendation that you should contract for the services of that third party. Third-party participants who contribute to IBKR Campus are independent of Interactive Brokers and Interactive Brokers does not make any representations or warranties concerning the services offered, their past or future performance, or the accuracy of the information provided by the third party. Past performance is no guarantee of future results.
This material is from Investopedia and is being posted with its permission. The views expressed in this material are solely those of the author and/or Investopedia and Interactive Brokers is not endorsing or recommending any investment or trading discussed in the material. This material is not and should not be construed as an offer to buy or sell any security. It should not be construed as research or investment advice or a recommendation to buy, sell or hold any security or commodity. This material does not and is not intended to take into account the particular financial conditions, investment objectives or requirements of individual customers. Before acting on this material, you should consider whether it is suitable for your particular circumstances and, as necessary, seek professional advice.
Disclosure: Futures Trading
Futures are not suitable for all investors. The amount you may lose may be greater than your initial investment. Before trading futures, please read the CFTC Risk Disclosure. A copy and additional information are available at ibkr.com.
Disclosure: ETFs
Any discussion or mention of an ETF is not to be construed as recommendation, promotion or solicitation. All investors should review and consider associated investment risks, charges and expenses of the investment company or fund prior to investing. Before acting on this material, you should consider whether it is suitable for your particular circumstances and, as necessary, seek professional advice.


Join The Conversation
If you have a general question, it may already be covered in our FAQs. If you have an account-specific question or concern, please reach out to Client Services.