


In the aftermath of the Covid-19 pandemic, the U.S. consumer has been either a silent hero or an economic menace, depending on your perspective. Consistent consumer spending fueled by strong fiscal stimulus and other developments allowed the U.S. economy to quickly recover from the deep but short recession in 2020. On the other hand, persistent consumer spending has caused demand to outpace supply, making it increasingly difficult for the Federal Reserve to curtail inflation. In this commentary, we discuss reasons for the strong spending following the Covid-19 recession and provide insight into when individuals may finally tighten their purse strings, which in our view will push the economy closer to a shallow recession.
Consumers Become Increasingly Important
The potential for a soft landing, or a decline in inflation and continued but slow economic growth, is likely to be determined by the financial health of consumers. In the face of higher living costs due to inflation, loftier interest rates, reduced credit availability and the end of fiscal stimulus, consumer spending has been surprisingly strong. This continued spending may require the Fed to remain hawkish for a prolonged period, increasing the risk of economic turbulence. An abrupt decline in spending, however, could send the economy into a downturn with consumer spending representing approximately 70% of gross domestic product. In an ideal scenario, consumers would curtail their spending enough to allow price gains to weaken but still spend enough to support economic growth.
Tailwinds for Consumer Spending
A unique combination of the following one-time events and ongoing events has driven unusually strong consumer spending:
- One-time events include record fiscal stimulus in the forms of checks sent to most households to limit the depth and duration of the 2020 recession that was triggered by efforts to contain the Covid-19 pandemic. Additionally, the Paycheck Protection Plan pumped more money into the economy by subsidizing payrolls, thereby helping to reduce layoffs. Many consumers also benefited from enhanced unemployment benefits and a pause in student loan payment requirements while saving on commuting costs when they were told to work from home during the pandemic.
- The Fed’s quantitative easing program comprising $120 billion of monthly bond purchases of which $80 billion was U.S. Treasuries and $40 billion was mortgage-backed securities pushed longer-term debt yields lower. Furthermore, the central bank lowered the federal funds rate to a range of between 0% and 0.25%, which subdued shorter-term interest rates across the economy. These accommodative monetary adjustments supported the prices of equities, bonds and real estate, increasing the wealth of consumers which boosted sentiment and bolstered spending.
- Low interest rates supported sales of homes and durable goods when Americans were sheltering in place.
Unprecedented Fiscal Stimulus
The Internal Revenue Service determined that $814 billion was distributed as of the end of 2021 to provide financial relief to households that were impacted by the pandemic. While consumers splurged on household goods during the pandemic and eventually ran up credit card debt, many households emerged financially stronger as a result of the program. The Federal Reserve Bank of New York estimates that roughly 38% of stimulus checks were saved, 35% were used to pay down debt, while the remaining 27% was spent.
Consumers Get a Holiday from Student Loan Payments
In March of 2020, the U.S. suspended payment requirements on government-provided student loans for an initial 60-day period. This loan-payment holiday was repeatedly extended but ends this month. Households dish out approximately $70.3 billion on government-provided student loans each year, so the holiday was a significant boost for consumers’ finances. Based on that annual amount, households were allowed to defer approximately $241 billion in student loan payments. As borrowers begin to pay back their college debt, the resulting pressure on spending will shave off at least 0.6% and up to 0.9% from real GDP through direct and indirect channels.
Mortgage Relief
In July 2020, the benchmark 30-year mortgage rate dipped below 3% for the first time in history. The good times continued with the rate falling to 2.65% by January of 2021 and recording an average for that year of 2.96%.

At that rate, a $200,000 mortgage would have a monthly payment of $800, approximately $700 less than if the rate was at its long-term average of 8%. When considering the 9 million mortgages that were refinanced without equity extraction following the pandemic, households are saving a whopping $24 billion annually according to the Federal Reserve Bank of New York.
Commuters Catch a Break on Transportation Costs
While monthly transportation costs may seem small, at least for some employees with short commutes, the cumulative impact of driving and taking public transportation to work locations is substantial. During shelter-at-home policies intended to curtail the spread of Covid-19, households were able to eliminate these expenses. Clever Real Estate estimates the average U.S. commuter spends almost 19% of their household expenditures on commuting, which averages out to $8,466 on an annual basis. When factoring the value of individuals’ time when making the schlep to the office and home, commuting costs Americans more than $16 billion annually. Consumers are also saving on purchasing food, services and goods near their offices which are generally much pricier than near their homes.
During the pandemic, the timing of shelter-in-place practices among states and employers’ work-from-home policies varied substantially, but if half of the nation’s commuters worked remotely for one year, then households, in aggregate, would have saved $8 billion. Commuters are continuing to save on transportation costs because many employers have hybrid work-from-home policies, reducing the number of days that workers commute.
Equity and Real Estate Payday
After a bruising 2022 of negative equity returns, the S&P 500 rallied approximately 14% year-to-date, increasing household wealth by roughly $2.6 trillion and setting a new household wealth record of $154.28 trillion. Gains in home values have also supported the increase in household wealth with homeowners’ equity increasing to $30 trillion, nearly matching the peak of 2022. In recent months, higher interest rates have caused stock performance to weaken while elevated mortgage rates have prevented homeowners from relocating, resulting in a shortage of homes for sale, which has prevented price discovery in the asset class. Homeowners realize that a new mortgage for acquiring a home would have substantially higher interest rates than their current mortgages, resulting in much higher interest expenses. Commercial real estate, however, is financed mainly through floating rate mortgages and has experienced severe price declines across the office and apartment building segments.
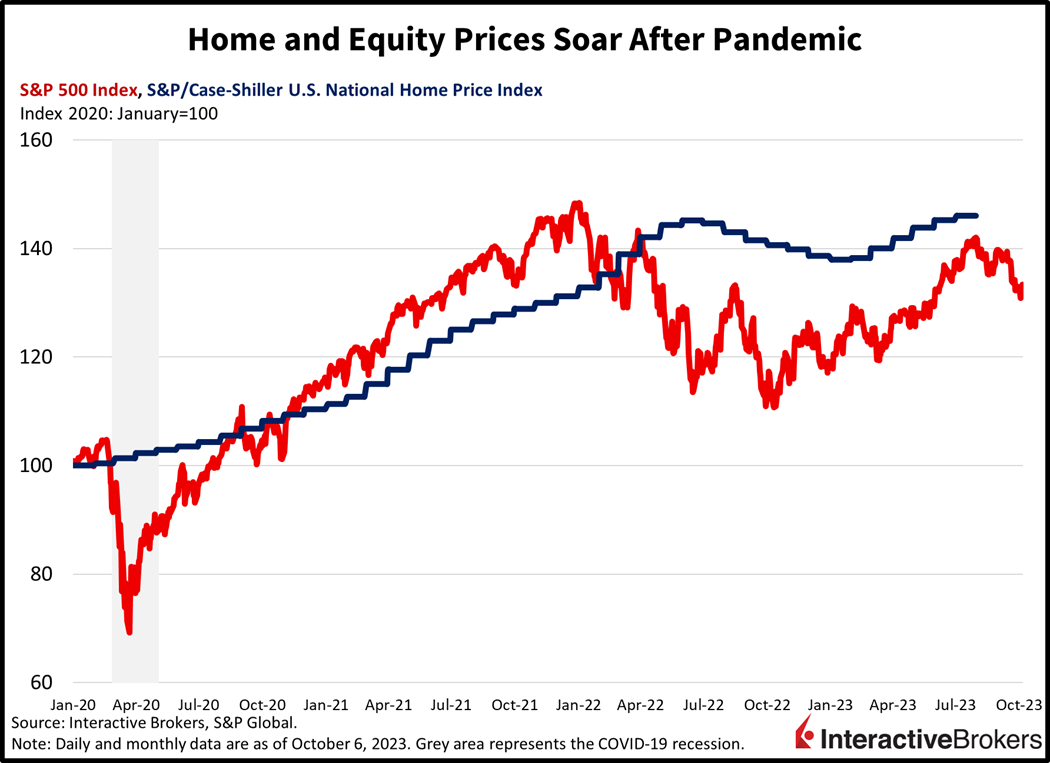
Many Americans hold stocks within retirement plans so market gains don’t always lead to increased spending power. In a similar manner, increasing home values only directly supports spending if consumers take out home equity loans. The spring and summer stock rally and increased home equity values, however, likely supported consumer sentiment, which in turn led to increased spending via the wealth effect. When consumers get richer, they spend more.
Consumers Say Goodbye to Pandemic Stimulus
The unprecedented combination of fiscal stimulus and other factors discussed above has clearly ignited consumer spending in the past few years. Some of these factors, such as fiscal stimulus checks, are waning, while others, such as savings for Americans who refinanced mortgages, will persist for years.
Consider the following:
- Fiscal stimulus checks to households are likely to be depleted this month as consumers bend against the weight of lofty prices, elevated financing costs and diminishing credit availability. When comparing the pre-pandemic savings trend compared to today, the recent boom in spending has likely run its course. Excess savings have declined to only $300 billion as of August and will likely be depleted this month.
- Transportation costs for consumers could increase if employers end hybrid work-from-home arrangements. Additionally, the student loan payment holiday ends this month.
- Wage gains may, or may not, moderate. On one hand, the tight labor market is easing slightly, yet an increase in union strikes, including the United Auto Workers actions targeting the three largest auto manufacturers, could spark an upward wage and inflation spiral. Federal Reserve Chairman Jerome Powell, however, has repeatedly said that curtailing inflation will require the labor market to soften, so if the market remains tight, the Fed may increase its fed funds rate until the job market and wage pressures ease.
- Equity market gains are unlikely to continue in the near-term with higher interest rates, a stronger dollar, and wage pressures weighing upon corporate earnings, while slower ordering from customers is hurting business revenues.
Heading for a Tipping Point?
Many of the most powerful pandemic stimulus tailwinds for households, such as Treasury checks sent to Americans and the college debt payment holiday, are waning, so the outlook for consumer spending is likely to be driven by factors such as wages relative to inflation, employment growth, savings rates, disposable income and debt-service ratios.
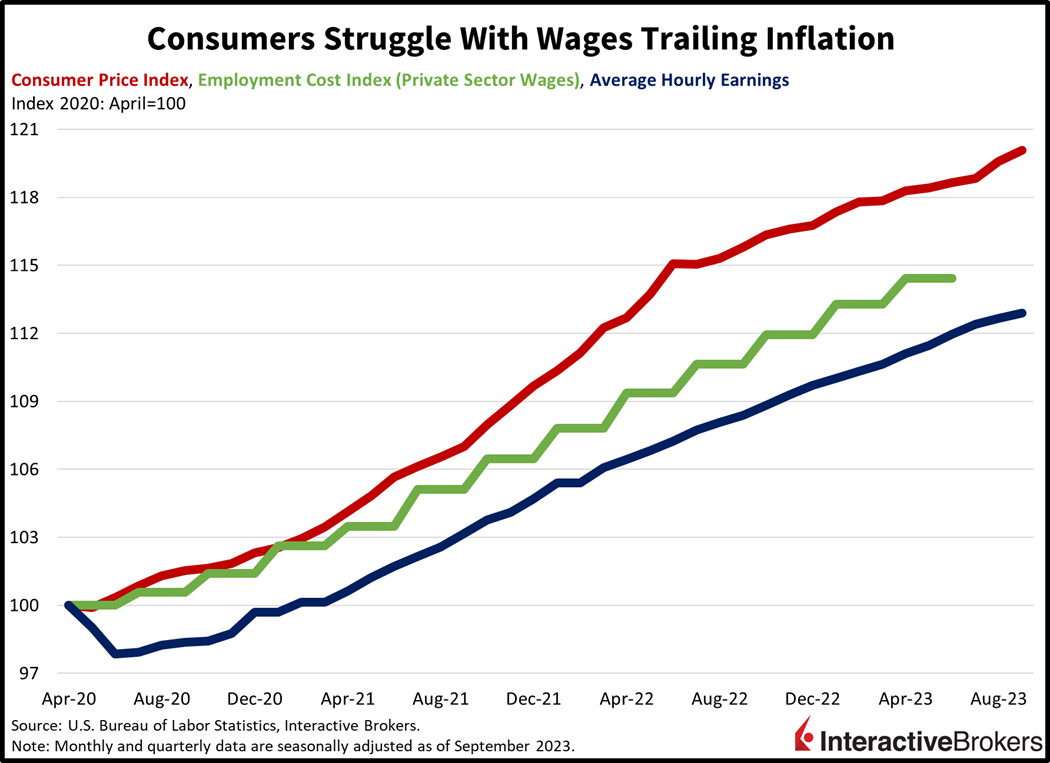
Wages Trail Inflation
For part of 2023, wage gains exceeded inflation, but from a longer-term view, consumer spending has been hampered by wages trailing inflation prior to this year. Due to the cumulative impact of inflation relative to wages, workers require a significant increase in earnings to breakeven as shown in the chart below.
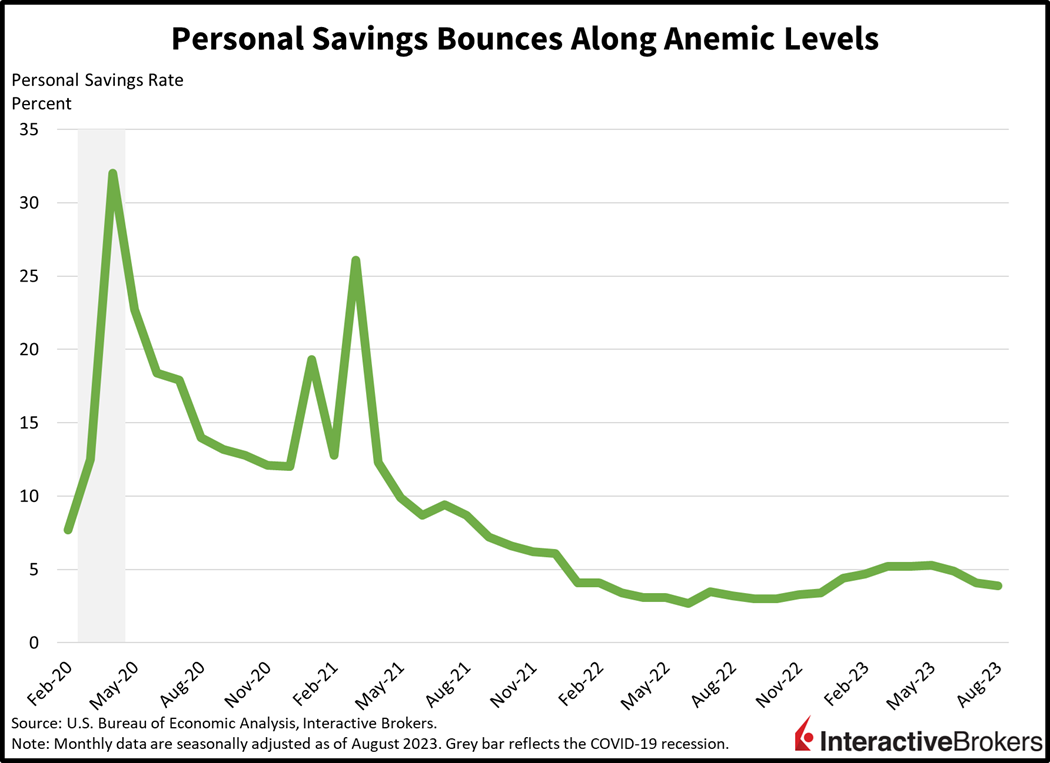
Anemic Savings Rate
In 2020 and 2021, stimulus checks swelled Americans’ bank accounts, thereby creating an anomaly in the personal savings rate and an all-time high of 33%. Otherwise, the personal savings rate, which is personal savings as a percentage of disposable income (DPI) has been anemic, a result of wages trailing inflation, higher consumer financing costs and the normalization of government transfer payments. The savings rate steadily declined as Americans burned through their stimulus checks, hitting a low of 2.7% in June of last year, the lowest level since 2008. For the 12-month period ended in August of this year, the median savings rate has been only 4.3%. In comparison, from the July 2009 end of the Great Recession until the month before the March 2020 Covid-19 recession, the median savings rate was 5.9%.
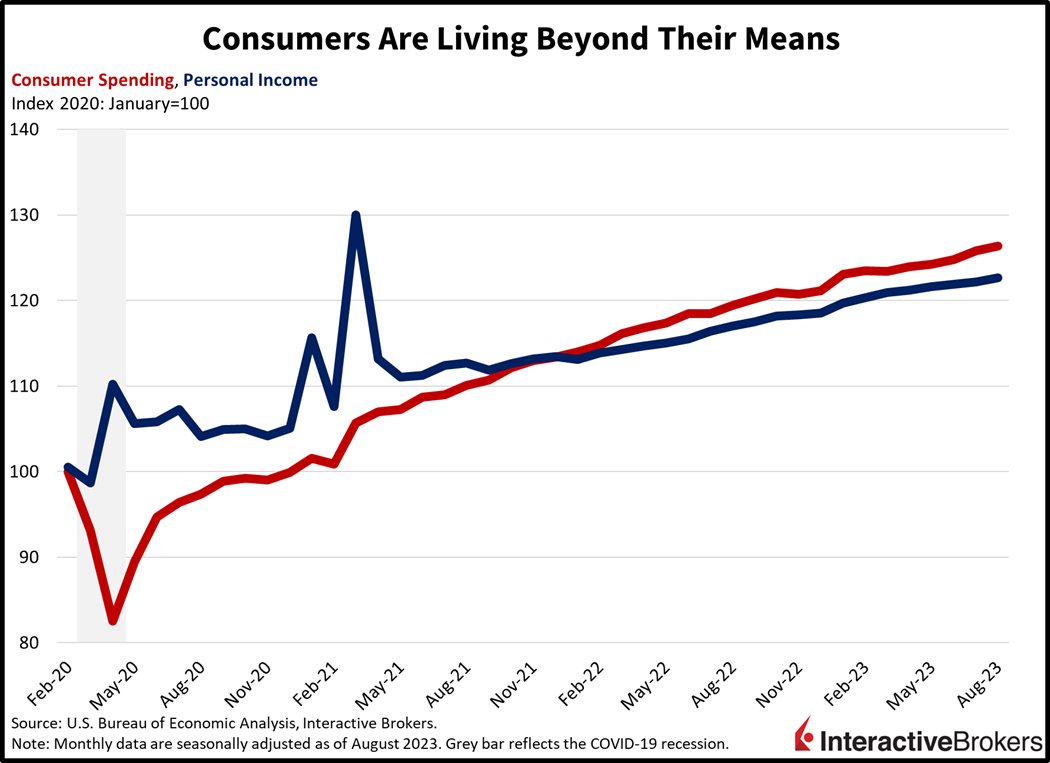
Disposable Income Lagging Increases in Expenditures
Meanwhile, consumers are continuing to spend beyond their means based on month-over-month changes in income and spending.
Debt Service Ratios
Consumers have sustained their spending by piling on credit card debt with interest rates that typically exceed 20% and could potentially go higher if the Federal Reserve continues to hike rates. Federal Reserve Chairman Jerome Powell has noted that credit card debt is currently sustainable as it is now comparable to pre-pandemic levels. From a broader perspective, however, debt could become a tipping point for consumer spending and it implies that consumers don’t have much excess discretionary income.
The household debt service ratio of 9.8% for the second quarter of this year is significantly lower than at the start of the following three recessions that occurred in the years before the Covid-19 pandemic:
- For the fourth quarter of 2007, which occurred just prior to the Great Recession, the rate was 13.17%.
- For the first quarter of 2001, which occurred just prior to the dot-com recession, the rate was 12.12%.
- For the second quarter of 1990 that occurred just before the savings and loan crisis recession, the rate was 11.60%.
A Potential Consumer Spending Squeeze
Consumers could be heading for a perfect storm if disposable income increases continue to lag increases in personal consumption expenditures and if the Federal Reserve maintains lofty interest rates, which would cause credit card interest rates to increase, thereby increasing household debt service ratios. Additionally, as shown by the low savings rate, consumers may have little capacity for navigating higher interest rates and cost of living increases caused by inflation and other factors, such as higher gasoline prices resulting from OPEC + production cuts.
Research from the LendingClub determined that 61% of Americans are living paycheck to paycheck, which underscores the challenges faced by many consumers. Among individuals earning less than $50,000 annually, 8 in 10 are living paycheck to paycheck and among consumers earning more than $100,000, 4 in 10 are living paycheck to paycheck.
Early Warning Signs
An increase in delinquency rates for credit card and automobile loan payments can be an early indicator of consumers being overstretched. Other important red flags include tightening lending standards and weakening consumer sentiment. The following observations, therefore, point to a significant slowdown in consumer spending and the economy.
- The 30 days or more delinquency rates for credit card payments and auto loans have been climbing after dropping in 2021 to the lowest levels since 2003. The low delinquency rates resulted, in large part, from consumers using fiscal stimulus payments to catch up on loan payments and also using the payments instead of credit, thereby avoiding piling up unstainable levels of debt. Since then, credit card and auto loan delinquency rates have climbed to 7.20% and 7.28%, respectively. This increase implies that consumers have burned through fiscal stimulus payments and are now subsidizing their living standards with increasingly unstainable levels of debt. The credit card delinquency rate is the highest level since the first quarter of 2012 and the auto loan delinquency rate is the highest since the first quarter of 2018.
With delinquency rates for credit cards and auto loans increasing, this month’s resumption of student loan payments could further challenge consumers’ finances and cause them to tighten their purse strings.
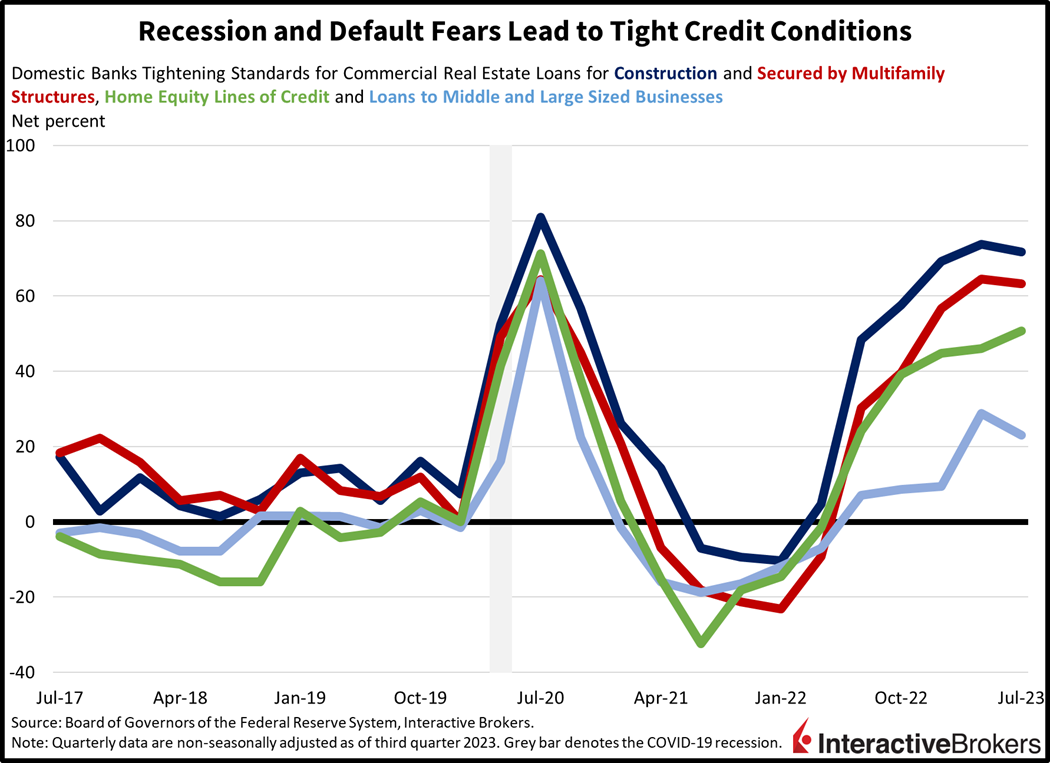
- Meanwhile, the benefit of consumers having saved money on commuting is showing its downside—regional banks have faced increased commercial real estate loan defaults as demand for urban offices has tanked while rent growth in newly built multifamily apartments has turned negative. This has contributed to banks tightening credit standards, making it harder for businesses and consumers to qualify for loans. Banks are also tightening credit standards in response to concerns that many consumers are struggling to make debt payments and fears that the economy will continue to weaken. In addition, the higher long-term yields have caused banks to reduce their lending so they can preserve capital buffers due to risks of further deposit outflow.
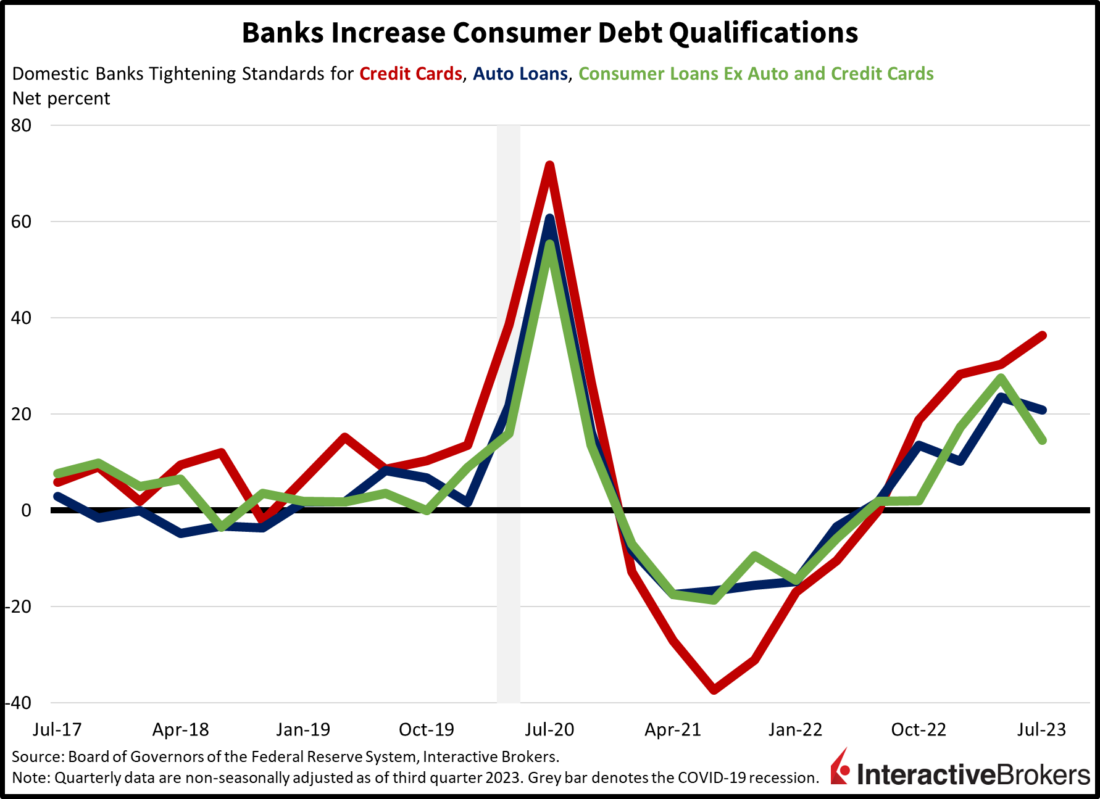
During the third quarter of this year, 36.4% of banks reported tightening standards for credit card borrowers, the highest level since the first quarter of 2020. Additionally, in each of the three quarters leading up to April, the percentage of banks tightening credit card requirements ranged from 18.8% to 30.4%. Moreover, in the Federal Reserve’s quarterly survey of senior loan officers, banks are tightening credit standards across debt offerings, thereby making it harder for businesses to qualify for financing.
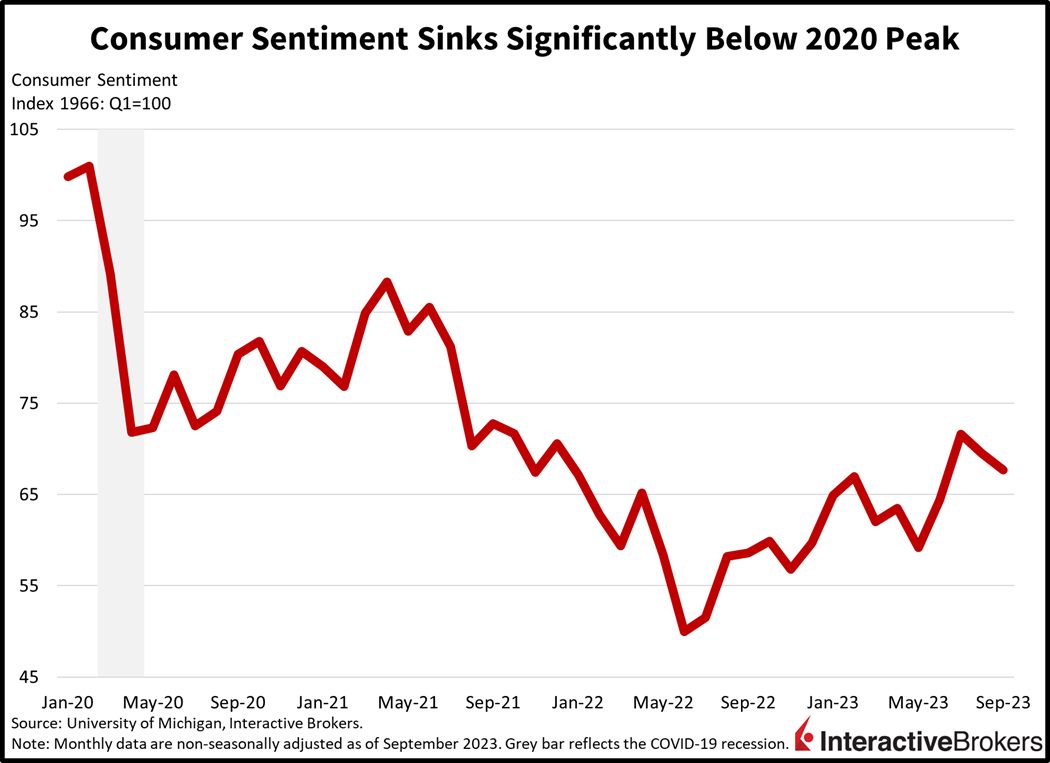
- Consumer sentiment has also been weakening during the last three months, signaling that consumers may be nearing the end of their shopping spree. In September, the decline was driven primarily by weakened sentiment regarding personal finances as consumers’ outlook for the business environment improved modestly from August.
- The combination of high levels of credit card balances, outstanding car note liabilities, looming student loan payments and climbing interest rates is likely to cause borrowers to deleverage and reduce their spending.
- The dip in real spending (inflation adjusted) is likely to be reflected mostly in services, which is already feeling the pain of consumers being over stretched, slowing to a growth rate of 0.2% in August from 0.6% and 0.3% in July and June, respectively. Durable goods are reflecting a similar story, with spending contracting 0.3% in August from 1.2% in July and unchanged in June. Indeed, goods spending overall (durables and nondurables) contracted 0.2% in August, the first decline since March’s 1% contraction.
Home Equity to the Rescue
One unknown is if consumers will tap their home equity to sustain their spending. This wouldn’t be the first time that this has occurred. In the spring of 2007, former Federal Reserve Chairman Alan Greenspan and Fed economist James Kennedy estimated that the surging home values in the years leading up to 2005 were accompanied by homeowners using home equity loans to boost spending. When considering the use of home equity loans to pay down credit cards as well as for other functions, Greenspan and Kennedy estimated that homeowners’ use of home equity loans contributed to close to 3% of consumer spending from 2001 to 2005, up from only 1.1% from 1991 to 2000. When combining both periods, homeowners’ tapping equity propelled consumer spending an average of $115 billion annually. Homeowners may balk at tapping home equity loans because many individuals have record-low mortgage rates occurring during the Covid-19 pandemic recession as a reference point, making the current 8% to 10% range in home equity seems unpalatably high. Yet during 2001 to 2005, mortgage rates and home-equity loan rates were comparable to the current rate.
Changing Seats on the Titanic
An increase in homeowners tapping home equity is likely to only delay a contraction in consumer spending. In some cases, homeowners may use home equity loans to pay down high interest credit card debt, but others may use home equity loans to maintain unsustainable spending. The potential increase in home equity debt will result in excessive debt service obligations, causing further stretching of consumers’ finances that may even intensify the eventual decline in consumer spending.
Visit Traders’ Academy to Learn More About Economic Indicators.
Disclosure: Interactive Brokers
Information posted on IBKR Campus that is provided by third-parties does NOT constitute a recommendation that you should contract for the services of that third party. Third-party participants who contribute to IBKR Campus are independent of Interactive Brokers and Interactive Brokers does not make any representations or warranties concerning the services offered, their past or future performance, or the accuracy of the information provided by the third party. Past performance is no guarantee of future results.
This material is from IBKR Macroeconomics and is being posted with its permission. The views expressed in this material are solely those of the author and/or IBKR Macroeconomics and Interactive Brokers is not endorsing or recommending any investment or trading discussed in the material. This material is not and should not be construed as an offer to buy or sell any security. It should not be construed as research or investment advice or a recommendation to buy, sell or hold any security or commodity. This material does not and is not intended to take into account the particular financial conditions, investment objectives or requirements of individual customers. Before acting on this material, you should consider whether it is suitable for your particular circumstances and, as necessary, seek professional advice.


Join The Conversation
If you have a general question, it may already be covered in our FAQs. If you have an account-specific question or concern, please reach out to Client Services.