


By: Michael W Arone, CFA, Matthew J Bartolini, CFA, CAIA, Anqi Dong, CFA, CAIA
The threat of recession has loomed over investors for more than a year, ignited by the inversion of the yield curve, which typically predates a recession by six to 24 months.1 That relationship has held since 1955, with just one false signal over a nearly 70-year period.
After first inverting in April 2022, the yield curve has been persistently inverted since July. That puts us roughly in the middle of the recession window. So, will the “yield curve as predictor of recession” relationship hold?
If you’re an optimist, you might believe the economy will face only a protracted slowdown, buoyed by the resilient consumer and a strong jobs market. But pessimists are more likely to brace for recession, pointing to multiple leading economic indicators skewed to the downside.
These divergent viewpoints and potential outcomes make portfolio diversification even more vital now. To pursue current cyclical opportunities without giving up potential downturn protection, consider a mix of the following:
- Cyclical industries, especially the consumer-centric Homebuilders and Transportation
- Gold, whether growth only slows or a technical recession occurs
- Non-cyclical stocks, to combat volatility and position for recession
To better understand the dual-nature of this economic backdrop, let’s dive a little deeper.
Leading Indicators Signal Recession Risks
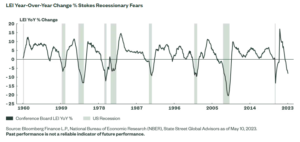
Among the many indicators pointing to economic weakness, readings on year-over-year (YoY) changes of the Conference Board US Leading Ten Economic Indicators Index (LEI) have been negative and declining for the past nine months.
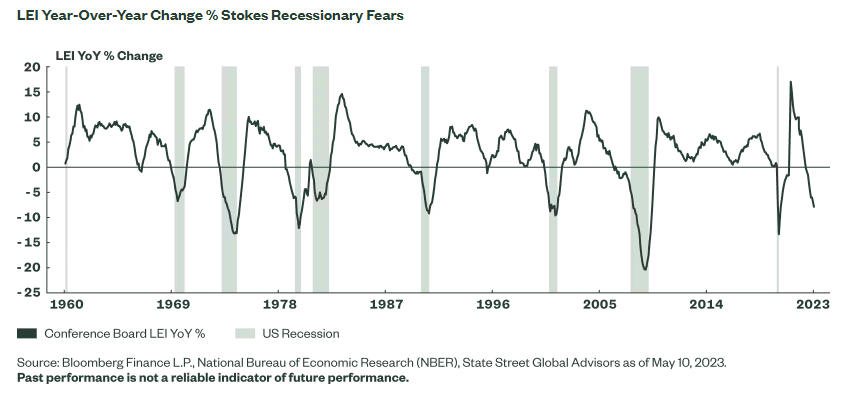
Negative readings have coincided with every US recession except in 1960. Only the recessions of 1975 and 2009 were preceded by more consecutive months of negative YoY changes.2
So, while the LEI’s current change of -7.8% is not as weak as historical cycles (all recessions except for 1970 had deeper declines), the duration of negative readings is significant. Also backing the view that recession is coming, 75% of the indicators that make up the LEI are in decline right now.3
But not everything is in decline.
Strong Labor Boosts Consumer Spending, Outlook for Cyclicals
The labor market remains strong, with the employment-population ratio for those aged 25-54 rising to 80.8% — its highest level since 2001.4 And while tech and banking have had layoffs, other industries are increasing pay to attract workers. In fact, average hourly earnings are up 4.4% from a year ago.5
Unlike the lack of breadth in the economy, job growth is broad-based. Despite some softening, the Bureau of Labor Statistics’ diffusion index still sits above 50,6 underscoring the resilience of labor demand amid elevated interest rates and sluggish macro trends.
Higher wages have increased disposable incomes. Inflation-adjusted disposable income, the main support for consumer activity, increased 0.3% recently.7 This pushed the savings rate to 5.1%, the highest since the end of 2021, indicating healthy consumer balance sheets.8 And credit card delinquencies are still below average, despite record credit card debt.9
These gains in labor and wages are supporting consumer spending — the largest portion of economy — and keeping growth positive. In the Q1 GDP report, the consumer was the main driver of growth, expanding by 3.7% compared to the 1.1% headline figure.10
In fact, inflation-adjusted final sales to private domestic purchasers, a key gauge of underlying demand, rose 3.2% on the quarter, the most since Q2 2021.11 Forward-looking consumer sentiment indicators have been improving as well, climbing off the bottom from mid-2022.12
Homebuilders Benefits from Stable Earnings, Constructive Valuations
With Homebuilders reporting better-than-anticipated new home sales and higher traffic of prospective buyers, the National Association of Home Builders (NAHB) Confidence Index has climbed every month this year.13
A slight decline in mortgage rates from the cyclical peak in 202214 has also contributed to improved confidence. And if the Fed does lower policy rates, mortgage rates that are still elevated relative to historical averages could fall further.15
The earnings outlook for Homebuilders has stabilized against this backdrop. The number of earnings downgrades decreased heading into the spring and remains at its lowest level in a year.16 Thanks to easing supply chain pressures and disinflationary trends in goods, prices of building materials have declined on an year-over-year basis for three straight months to the level of April 2021.17
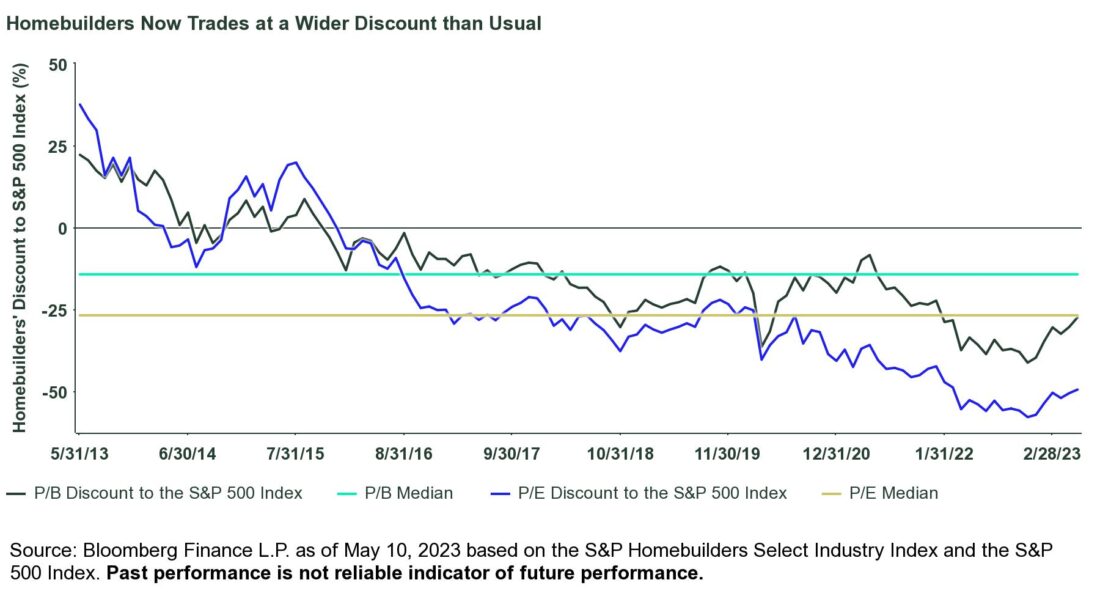
With that tailwind, Homebuilders reported strong Q1 2023 earnings (25% above estimate versus the 6% for the S&P 500 Index) and sales surprises (8% above estimates versus 3% for S&P 500 Index).18 Importantly, this recent strength hasn’t extended valuations.
After falling by 30% in 2022, the industry still has plenty of room to make up. Both on a price-to-earnings (P/E) and price-to-book (P/B) basis, Homebuilders is trading at a larger than normal discount to the S&P 500 Index, as shown in the following chart.19
Overall, housing supply remains tight while demand remains strong — boosted by the strong labor markets and healthy household balance sheets. Alongside improving earnings trends and constructive valuations, this may lead to a more optimistic outlook for this consumer-oriented industry.
Click here to read the full article
Footnotes
1 Michael D. Bauer and Thomas M. Mertens, “Economic Forecasts with the Yield Curve,” Federal Reserve Bank of San Francisco.
2 Bloomberg Finance, L.P., National Bureau of Economic Research (NBER), State Street Global Advisors as of 05/10/2023.
3 Bloomberg Finance, L.P., as of April 30, 2023 based on the LEI Diffusion Index reading of 25.
4 Bloomberg Finance, L.P., as of April 30, 2023 based on Bureau of Labor Statistics data.
5 Bloomberg Finance, L.P., as of April 30, 2023 based on Bureau of Labor Statistics data.
6 Bloomberg Finance, L.P., as of April 30, 2023 based on Bureau of Labor Statistics data. Bureau of Labor Statistics Employment. Diffusion Nonfarm Payrolls +3 Month SA Index is 61.2.
7 Bloomberg Finance, L.P., as of April 30, 2023 based on Bureau of Economic Analysis data.
8 Bloomberg Finance, L.P., as of April 30, 2023 based on Bureau of Economic Analysis data.
9 Bloomberg Finance, L.P., as of April 30, 2023.
10 Bloomberg Finance, L.P., as of April 30, 2023 based on Bureau of Economic Analysis data.
11 Bloomberg Finance, L.P., as of April 30, 2023 based on Bureau of Economic Analysis data.
12 Bloomberg Finance, L.P., as of April 30, 2023 based on the University of Michigan Consumer Sentiment Index which is now at 63.50, a 27% increase from June 2022.
13 Bloomberg Finance, L.P., as of April 30, 2023 based on National Association of Home Builders Market Index.
14 Bloomberg Finance, L.P., as of April 30, 2023 based on Mortgage Bankers Associate data.
15 Bloomberg Finance, L.P., as of April 30, 2023 based on Mortgage Bankers Associate data.
16 FactSet, as of 5/10/2023. The industry is represented by the S&P Homebuilders Select Industry Index.
17 US Bureau of Labor Statistics, PPI by Industry: Building Material and Supplies Dealers, as of 3/31/2023.
18 FactSet as of April 30, 2023.
19 Bloomberg Finance, L.P., as of 05/10/2023 based on the S&P Homebuilders Select Industry Index and the S&P 500 Index.
20 The International Air Transport Association (IATA).
21 IATA – Airlines Cut Losses in 2022; Return to Profit in 2023.
22 Bloomberg Finance, L.P., as of 05/10/2023 based on the return of the S&P Transportation Select Industry Index in 2022.
23 Bloomberg Finance, L.P., as of 05/10/2023 based on the S&P Transportation Select Industry.
24 Bloomberg Finance, L.P., as of 05/10/2023 based on the S&P Transportation Select Industry.
25 Bloomberg Finance, L.P., as of 05/10/2023 based on the Philadelphia Federal Reserve Partisan Conflict Index.
26 House Republicans pass U.S. debt bill, pushing Biden on spending | PBS NewsHour.
27 Bloomberg Finance, L.P., as of 5/15/2023 based on historical monthly returns for the MSCI USA Minimum Volatility Index and the Russell 1000 Index from 1995-2023.
28 Bloomberg Finance, L.P., as of 5/15/2023 based on historical monthly returns for the MSCI USA Minimum Volatility Index and the Russell 1000 Index from 1995-2023.
Glossary
Leading Economic Index (LEI)
The Composite Index of Leading Indicators, otherwise known as the Leading Economic Index (LEI), is an index published monthly by The Conference Board. It is used to predict the direction of global economic movements in future months. The index is composed of 10 economic components whose changes tend to precede changes in the overall economy. Businesses and investors can use the index to help plan their activities around the expected performance of the economy and protect themselves from economic downturns.
Recession
A period of temporary economic decline during which trade and industrial activity are reduced
Philadelphia Federal Reserve Partisan Conflict Index
Tracks the degree of political disagreement among U.S. politicians at the federal level.
NAHB Housing Market Index (HMI)
The Housing Market Index (HMI) checks the pulse of the single-family housing market, according to a monthly survey of NAHB members.
S&P Transportation Select Industry Index
S&P Select Industry Indices are designed to measure the performance of narrow GICS® sub-industries. The Index comprises stocks in the S&P Total Market Index that are classified in the GICS transportation sub-industry.
Price-to-Book
The price-to-book (P/B) ratio considers how a stock is priced relative to the book value of its assets
Price-to-Earnings
The price-to-earnings (P/E) ratio relates a company’s share price to its earnings per share.
Percentile Ranking
A system of ranking scores that shows the percentage of results that are lower than the benchmark or fund in question for the most recent three-year period. Every year, each score is updated with the most recent year’s percentiles.
Sector Investing
An investor or portfolio that invests assets into one or more sector of the economy such as financials, energy, or health care.
S&P 500® Index
A popular benchmark for U.S. large-cap equities that includes 500 companies from leading industries and captures approximately 80% coverage of available market capitalization.
Valuation
The process of determining the current worth of an asset or a company.
Low Volatility
A lower volatility means that a security’s value does not fluctuate dramatically, and tends to be more steady and has less systematic risk.
—
Originally Posted June 5, 2023 – Diversify Recession Risks with Cyclicals and Defensives
Important Risk Disclosures
This communication is not intended to be an investment recommendation or investment advice and should not be relied upon as such.
The views expressed in this material are the views of Michael Arone, Matthew Bartolini, and Anqi Dong through the period ended May 19, 2023 and are subject to change based on market and other conditions. This document contains certain statements that may be deemed forward-looking statements. Please note that any such statements are not guarantees of any future performance and actual results or developments may differ materially from those projected.
All information is from SSGA unless otherwise noted and has been obtained from sources believed to be reliable, but its accuracy is not guaranteed. There is no representation or warranty as to the current accuracy, reliability or completeness of, nor liability for, decisions based on such information and it should not be relied on as such.
Past performance is not a reliable indicator of future performance.
The trademarks and service marks referenced herein are the property of their respective owners. Third party data providers make no warranties or representations of any kind relating to the accuracy, completeness or timeliness of the data and have no liability for damages of any kind relating to the use of such data.
The whole or any part of this work may not be reproduced, copied or transmitted or any of its contents disclosed to third parties without SSGA’s express written consent.
Investing involves risk including the risk of loss of principal.
Diversification does not ensure a profit or guarantee against loss.
Frequent trading of ETFs could significantly increase commissions and other costs such that they may offset any savings from low fees or costs.
Companies with large market capitalizations go in and out of favor based on market and economic conditions. Larger companies tend to be less volatile than companies with smaller market capitalizations. In exchange for this potentially lower risk, the value of the security may not rise as much as companies with smaller market capitalizations.
Equity securities may fluctuate in value in response to the activities of individual companies and general market and economic conditions.
When the Fund focuses its investments in a particular industry or sector, financial, economic, business, and other developments affecting issuers in that industry, market, or economic sector will have a greater effect on the Fund than if it had not done so.
Passively managed funds hold a range of securities that, in the aggregate, approximates the full Index in terms of key risk factors and other characteristics. This may cause the fund to experience tracking errors relative to performance of the index.
Homebuilding companies can be significantly affected by the national, regional and local real estate markets. This industry is also sensitive to interest rate fluctuations which can cause changes in the availability of mortgage capital and directly affect the purchasing power of potential homebuyers. The building industry can be significantly affected by changes in government spending, consumer confidence, demographic patterns and the level of new and existing home sales.
Transportation companies can be significantly affected by changes in the economy, fuel prices, labor relations, technology developments, exchange rates, insurance costs, industry competition and government regulation.
Although subject to the risks of common stocks, low volatility stocks are seen as having a lower risk profile than the overall markets. However, a portfolio comprised of low volatility stocks may not produce investment exposure that has lower variability to changes in such stocks’ price levels. Low volatility stocks are likely to underperform the broader market during periods of rapidly rising stock prices.
Investing involves risk, and you could lose money on an investment in each of SPDR® Gold Shares Trust (“GLD®” or “GLD”) and SPDR® Gold MiniShares® Trust (“GLDM®” or “GLDM”), a series of the World Gold Trust (together, the “Funds”).
Commodities and commodity-index linked securities may be affected by changes in overall market movements, changes in interest rates, and other factors such as weather, disease, embargoes, or political and regulatory developments, as well as trading activity of speculators and arbitrageurs in the underlying commodities.
Investing in commodities entails significant risk and is not appropriate for all investors.
Important Information Relating to GLD® and GLDM®:
GLD and the World Gold Trust have each filed a registration statement (including a prospectus) with the Securities and Exchange Commission (“SEC”) for GLD and GLDM, respectively. Before you invest, you should read the prospectus in the registration statement and other documents each Fund has filed with the SEC for more complete information about each Fund and these offerings. Please see each Fund’s prospectus for a detailed discussion of the risks of investing in each Fund’s shares. The GLD prospectus is available by clicking here, and the GLDM prospectus is available by clicking here. You may get these documents for free by visiting EDGAR on the SEC website at sec.gov or by visiting spdrgoldshares.com. Alternatively, the Funds or any authorized participant will arrange to send you the prospectus if you request it by calling 866.320.4053.
None of the Funds is an investment company registered under the Investment Company Act of 1940 (the “1940 Act”). As a result, shareholders of each Fund do not have the protections associated with ownership of shares in an investment company registered under the 1940 Act. GLD and GLDM are not subject to regulation under the Commodity Exchange Act of 1936 (the “CEA”). As a result, shareholders of each of GLD and GLDM do not have the protections afforded by the CEA.
Shares of each Fund trade like stocks, are subject to investment risk and will fluctuate in market value.
The values of GLD shares and GLDM shares relate directly to the value of the gold held by each Fund (less its expenses), respectively. Fluctuations in the price of gold could materially and adversely affect an investment in the shares. The price received upon the sale of the shares, which trade at market price, may be more or less than the value of the gold represented by them.
None of the Funds generate any income, and as each Fund regularly sells gold to pay for its ongoing expenses, the amount of gold represented by each Fund share will decline over time to that extent.
The World Gold Council name and logo are a registered trademark and used with the permission of the World Gold Council pursuant to a license agreement. The World Gold Council is not responsible for the content of, and is not liable for the use of or reliance on, this material. World Gold Council is an affiliate of the Sponsor of each of GLD and GLDM.
MiniShares® is a registered trademark of WGC USA Asset Management Company, LLC used with the permission of WGC USA Asset Management Company, LLC. GLD® and GLDM® are registered trademarks of World Gold Trust Services, LLC used with the permission of World Gold Trust Services, LLC.
For more information, please contact the Marketing Agent for GLD and GLDM: State Street Global Advisors Funds Distributors, LLC, One Iron Street, Boston, MA, 02210; T: +1 866 320 4053 spdrgoldshares.com.
Disclosure: State Street Global Advisors
Do not reproduce or reprint without the written permission of SSGA.
All information has been obtained from sources believed to be reliable, but its accuracy is not guaranteed. There is no representation or warranty as to the current accuracy, reliability or completeness of, nor liability for, decisions based on such information and it should not be relied on as such.
State Street Global Advisors and its affiliates (“SSGA”) have not taken into consideration the circumstances of any particular investor in producing this material and are not making an investment recommendation or acting in fiduciary capacity in connection with the provision of the information contained herein.
ETFs trade like stocks, are subject to investment risk, fluctuate in market value and may trade at prices above or below the ETF’s net asset value. Brokerage commissions and ETF expenses will reduce returns.
Bonds generally present less short-term risk and volatility than stocks, but contain interest rate risk (as interest rates raise, bond prices usually fall); issuer default risk; issuer credit risk; liquidity risk; and inflation risk. These effects are usually pronounced for longer-term securities. Any fixed income security sold or redeemed prior to maturity may be subject to a substantial gain or loss.
Investing involves risk including the risk of loss of principal.
The whole or any part of this work may not be reproduced, copied or transmitted or any of its contents disclosed to third parties without SSGA’s express written consent.
Investing in high yield fixed income securities, otherwise known as “junk bonds”, is considered speculative and involves greater risk of loss of principal and interest than investing in investment grade fixed income securities. These Lower-quality debt securities involve greater risk of default or price changes due to potential changes in the credit quality of the issuer.
COPYRIGHT AND OTHER RIGHTS
Other third party content is the intellectual property of the respective third party and all rights are reserved to them. All rights reserved. No organization or individual is permitted to reproduce, distribute or otherwise use the statistics and information in this report without the written agreement of the copyright owners.
Definition:
Arbitrage: the simultaneous buying and selling of securities, currency, or commodities in different markets or in derivative forms in order to take advantage of differing prices for the same asset.
Fund Objectives:
SPY: The investment seeks to provide investment results that, before expenses, correspond generally to the price and yield performance of the S&P 500® Index. The Trust seeks to achieve its investment objective by holding a portfolio of the common stocks that are included in the index (the “Portfolio”), with the weight of each stock in the Portfolio substantially corresponding to the weight of such stock in the index.
VOO: The investment seeks to track the performance of a benchmark index that measures the investment return of large-capitalization stocks. The fund employs an indexing investment approach designed to track the performance of the Standard & Poor’s 500 Index, a widely recognized benchmark of U.S. stock market performance that is dominated by the stocks of large U.S. companies. The advisor attempts to replicate the target index by investing all, or substantially all, of its assets in the stocks that make up the index, holding each stock in approximately the same proportion as its weighting in the index.
IVV: The investment seeks to track the investment results of the S&P 500 (the “underlying index”), which measures the performance of the large-capitalization sector of the U.S. equity market. The fund generally invests at least 90% of its assets in securities of the underlying index and in depositary receipts representing securities of the underlying index. It may invest the remainder of its assets in certain futures, options and swap contracts, cash and cash equivalents, as well as in securities not included in the underlying index, but which the advisor believes will help the fund track the underlying index.
The funds presented herein have different investment objectives, costs and expenses. Each fund is managed by a different investment firm, and the performance of each fund will necessarily depend on the ability of their respective managers to select portfolio investments. These differences, among others, may result in significant disparity in the funds’ portfolio assets and performance. For further information on the funds, please review their respective prospectuses.
Entity Disclosures:
The trademarks and service marks referenced herein are the property of their respective owners. Third party data providers make no warranties or representations of any kind relating to the accuracy, completeness or timeliness of the data and have no liability for damages of any kind relating to the use of such data.
SSGA Funds Management, Inc. serves as the investment advisor to the SPDR ETFs that are registered with the United States Securities and Exchange Commission under the Investment Company Act of 1940. SSGA Funds Management, Inc. is an affiliate of State Street Global Advisors Limited.
Intellectual Property Disclosures:
Standard & Poor’s®, S&P® and SPDR® are registered trademarks of Standard & Poor’s® Financial Services LLC (S&P); Dow Jones is a registered trademark of Dow Jones Trademark Holdings LLC (Dow Jones); and these trademarks have been licensed for use by S&P Dow Jones Indices LLC (SPDJI) and sublicensed for certain purposes by State Street Corporation. State Street Corporation’s financial products are not sponsored, endorsed, sold or promoted by SPDJI, Dow Jones, S&P, their respective affiliates and third party licensors and none of such parties make any representation regarding the advisability of investing in such product(s) nor do they have any liability in relation thereto, including for any errors, omissions, or interruptions of any index.
BLOOMBERG®, a trademark and service mark of Bloomberg Finance, L.P. and its affiliates, and BARCLAYS®, a trademark and service mark of Barclays Bank Plc., have each been licensed for use in connection with the listing and trading of the SPDR Bloomberg Barclays ETFs.
Distributor: State Street Global Advisors Funds Distributors, LLC, member FINRA, SIPC, an indirect wholly owned subsidiary of State Street Corporation. References to State Street may include State Street Corporation and its affiliates. Certain State Street affiliates provide services and receive fees from the SPDR ETFs.
ALPS Distributors, Inc., member FINRA, is distributor for SPDR® S&P 500®, SPDR® S&P MidCap 400® and SPDR® Dow Jones Industrial Average, all unit investment trusts. ALPS Distributors, Inc. is not affiliated with State Street Global Advisors Funds Distributors, LLC.
Before investing, consider the funds’ investment objectives, risks, charges, and expenses. For SPDR funds, you may obtain a prospectus or summary prospectus containing this and other information by calling 1‐866‐787‐2257 or visiting www.spdrs.com. Please read the prospectus carefully before investing.
Disclosure: Interactive Brokers
Information posted on IBKR Campus that is provided by third-parties does NOT constitute a recommendation that you should contract for the services of that third party. Third-party participants who contribute to IBKR Campus are independent of Interactive Brokers and Interactive Brokers does not make any representations or warranties concerning the services offered, their past or future performance, or the accuracy of the information provided by the third party. Past performance is no guarantee of future results.
This material is from State Street Global Advisors and is being posted with its permission. The views expressed in this material are solely those of the author and/or State Street Global Advisors and Interactive Brokers is not endorsing or recommending any investment or trading discussed in the material. This material is not and should not be construed as an offer to buy or sell any security. It should not be construed as research or investment advice or a recommendation to buy, sell or hold any security or commodity. This material does not and is not intended to take into account the particular financial conditions, investment objectives or requirements of individual customers. Before acting on this material, you should consider whether it is suitable for your particular circumstances and, as necessary, seek professional advice.


Join The Conversation
If you have a general question, it may already be covered in our FAQs. If you have an account-specific question or concern, please reach out to Client Services.