


This morning’s retail sales report featured a sharp decline in US consumption to start off the new year, signaling the possibility of consumer fatigue following a robust holiday season. Economists are pondering whether this data marks a turn in the economic cycle or if it’s just a one-off. While corporate layoffs have been gaining momentum on earnings calls, this morning’s data also featured Japan and the United Kingdom slipping into technical recessions, or two consecutive quarters of economic contraction. Softer economic activity is pushing down interest rates, which is leading to investors buying stocks for a second-consecutive day.
Price Increases and Credit Limits Punish Consumers
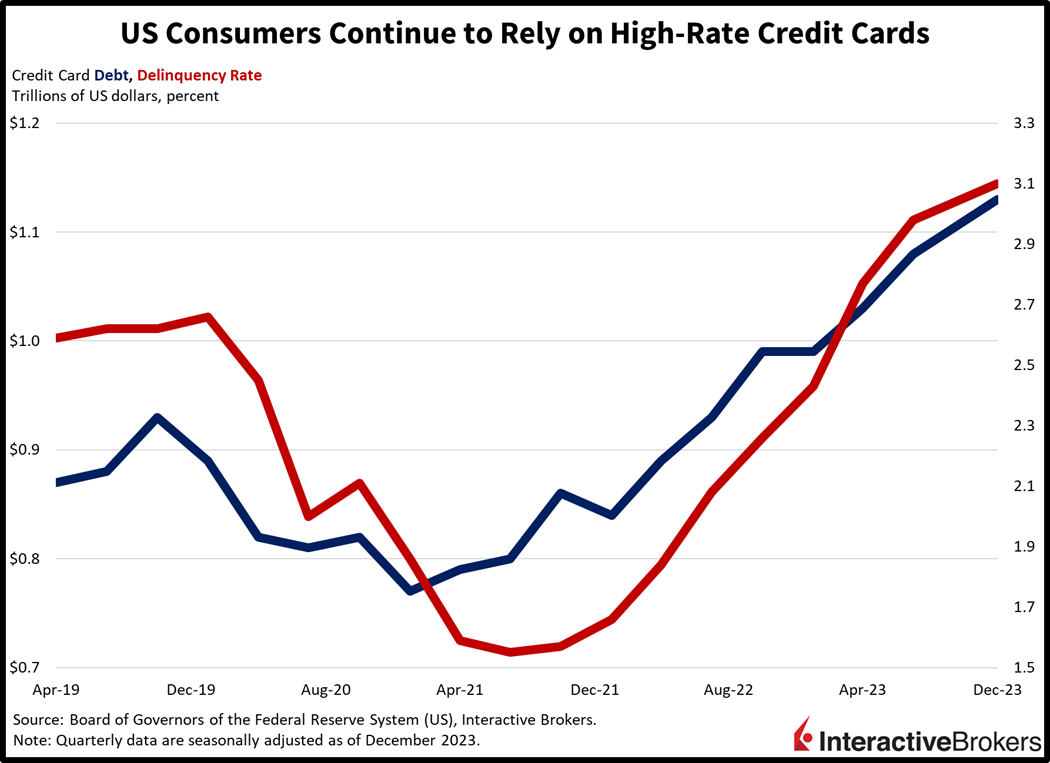
US retail sales slipped last month as elevated interest rates, persistent price hikes and rising credit card delinquencies weighed on households. Retail sales fell a sharp 0.8% month over month (m/m) in January, the sharpest contraction in 10 months. Sales missed the consensus estimate of -0.1% by a mile and reversed from December’s 0.4% pace of growth. Sales were a bit better when excluding automobiles, with the decline softening to just -0.6%. Excluding gasoline and automobiles, sales dropped 0.5%. The control group, which contributes heavily to the government’s consumption calculation relative to gross domestic product (GDP), fell 0.4%, its largest downswing since March as well.
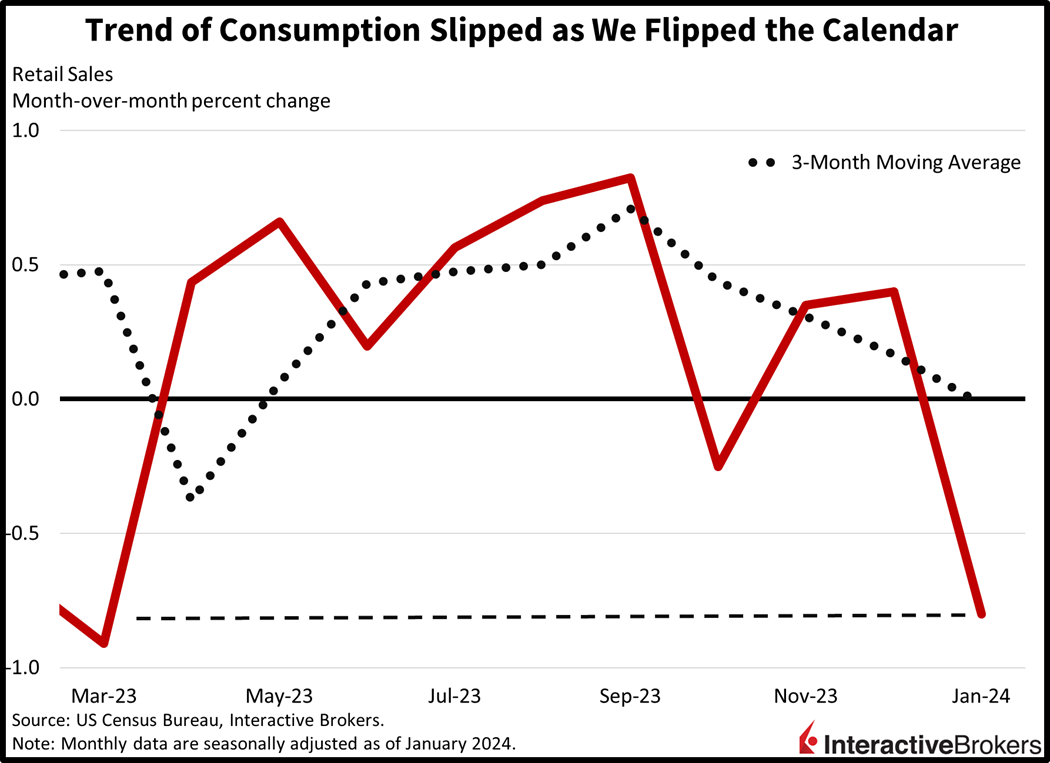
Transaction weakness was broad-based, with nine out of thirteen categories contracting. Building materials dealers led the free fall with a decline of 4.1%. Other categories and their declines included the following:
- Miscellaneous stores, 3%
- Automobile dealerships, 1.7%
- Gasoline stations, 1.7%
- Health and personal care shops, 1.1%
Ecommerce, electronics and appliances suppliers, sporting goods destinations and apparel stores also slid but by less than 1%. Offsetting some of the pain were furniture showrooms, which increased 1.5%, dining establishments, which climbed 0.7% and food markets, which increased 0.2%. General merchandise retailers were unchanged.
Labor Conditions Continue to Soften
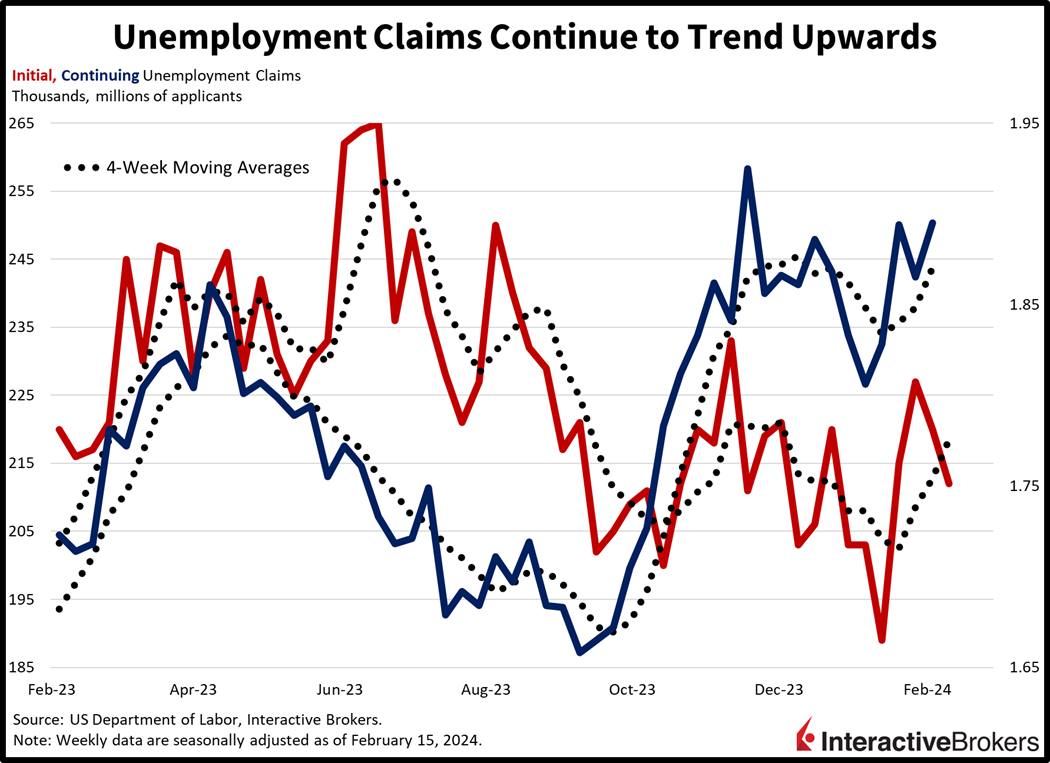
The trend of layoffs continues to increase, even though initial unemployment claims reported today softened from a week ago. Initial unemployment claims fell to 212,000 for the week ended February 10, missing projections for an unchanged level of 220,000 from the previous week. Continuing claims rose to 1.895 million, however, well above the median forecast of 1.880 million and the previous week’s 1.865 million. Meanwhile, the four-week moving average for both measures rose to 218,500 and 1.871 million from 212,750 and 1.848 million, respectively.
Global Trade Prices Climb
The far reach of inflation was illustrated in global trade last month with the indices for import and export prices rising a sharp 0.8% m/m despite forecasts expecting near an unchanged pace on both fronts. The following are highlights of m/m changes from today’s data:
- Price indices for fuel and non-fuel imports rose 1.2% and 0.7%
- Price indices for non-agricultural exports rose 0.9%
- The agricultural sector bucked the trend with export prices declining 1%
- Price indices for both exports and imports reversed their declines of 0.7% from December
The UK and Japan Enter Recessions
On a sobering note, the “R” word became more prevalent this week with the UK and Japan entering the technical definition of recession—two consecutive quarters of contracting GDP. In the UK, the Office of National Statistics reported that fourth-quarter GDP fell 0.3%, considerably worse than the 0.1% decline anticipated by analysts. In the prior quarter, the UK’s GDP declined 0.1%. The economic malaise is largely viewed as a result of the Bank of England’s restrictive monetary policy. Investors reacted by fully pricing three 25 basis points (bps) cuts this year and placing a 10% likelihood of a fourth cut. In Japan, the country’s ultra-accommodative monetary policy that includes negative interest rates failed to ward off another quarter of economic contraction causing investors to anticipate a delay in the Bank of Japan (BoJ) prospective rate hikes. Anemic domestic demand contributed to the country’s GDP declining at a 0.4% annualized pace in the fourth quarter, which followed a 3.3% decline in the third quarter. The recent contraction was unexpected, with only one of 34 economists surveyed anticipating negative GDP. Prior to the fourth-quarter data release, investors placed a 73% likelihood of the BoJ increasing its key interest rate in April. Investors have since lowered that expectation to 63%.
Guidance for Cisco and Deere & Co. Miss Expectations
Layoffs are continuing while guidance from recent earnings reports is disappointing investors as illustrated by the following examples:
- Cisco says it has 4,250 positions on the chopping block, roughly 5% of its workforce. Additionally, its disappointing guidance caused its share price to drop 9% in after-market trading. For the quarter ended January 27, the provider of internet connectivity and networking products posted an earnings per share (EPS) of $0.87 after adjusting for one-time expenses. The result declined 1% year over year but beat the analyst expectation of $0.84. Cisco’s revenue of $12.8 billion also fell, dropping 6% y/y, but it surpassed the analyst estimate of $12.7 billion. Among its various product lines, networking sales of $7.08 billion missed the analyst estimate of $7.10 billion. Cisco anticipates generating an adjusted EPS ranging from $0.84 to $0.86 and revenue ranging from $12.1 billion to $12.3 billion in the current quarter. The outlook missed the analyst expectation for an EPS of $0.92 and revenue of $13.09 billion. Cisco CEO Chuck Robbins says customers are being cautious in entering into new deals and they are also taking longer than the company anticipated when implementing technology. Additionally, demand is weak among cable service providers and telecommunication companies.
- Deere & Co. also posted disappointing guidance and its share price fell approximately 3.4% this morning despite the company’s quarterly results exceeding analysts’ expectations. Deere’s adjusted EPS of $6.23 beat the consensus estimate of $5.19 for the quarter ended January 28 but declined from $6.55 y/y. Its quarterly revenue of $12.19 billion declined 3.7% y/y but exceeded the analyst expectation of $10.3 billion. Sales of construction and forestry equipment increased marginally, but sales for production and precision agriculture products declined 7%. Additionally, sales for its small agriculture and turf products dropped 19%. Broadly speaking, price increases failed to offset the impact upon revenues from weakening shipping volumes. Deere said it anticipates generating a current-year EPS of $21, missing the analyst expectation of $23. The company lowered its net income estimate from $8 billion to $7.60 billion, explaining that a 37% y/y decline in corn prices is causing farmers to cut back on buying agriculture products.
Cyclical Stocks Lead Rally
Markets are in recovery mode since Tuesday’s selloff on the back of a scorching Consumer Price Index. Today’s data reminds investors that while inflation is gaining momentum, economic growth is showing signs of fatigue. The result is bringing in bond buyers looking to lock in the yields of the day, while motivating equity investors that crave and have learned to love lighter interest rates.
Most US equity indices are higher, led by the 1.3% gain of the rate-sensitive, cyclically tilted Russell 2000 Index. Meanwhile, the Dow Jones Industrial and S&P 500 indices are up 0.4% and 0.2%, respectively. Technology is lagging for a change, with the Nasdaq Composite Index down 0.2%. Sector breadth is impressively positive, with all sectors higher minus technology, which is down 0.3%. The real estate, energy and materials sectors are leading with increases of 1.7%, 1.7% and 1.5%. In fixed-income land, the 2- and 10-year Treasury maturities are trading at 4.57% and 4.24%, with both instruments down 2 bps on the session. The dollar is taking a break on the back of a fierce run and lighter rates, with the greenback’s index down 32 bps to 104.38. The US currency is down against all major currency pairs including the euro, pound sterling, franc, yen, yuan and Aussie and Canadian dollars. Despite a large build in US energy inventories and forecasts of slowing demand, tensions in the Middle East and a lighter dollar are pushing up the price of crude. WTI crude oil is up 1.3%, or $1.01, to $77.50 per barrel.
Stagflationary Data Threaten Potential Soft Landing
Today’s data was certainly stagflationary, with consumption weakness in the US, UK and Japan occurring at a time of accelerating global inflation. While market participants yesterday largely dismissed Tuesday’s hot inflation report, significant risks lie ahead. February inflation is already tracking faster than January while we’re seeing recessionary conditions globally amidst a slowing consumer stateside. Significant downside in equities is likely to occur if these developments continue, with inflation keeping central banks at bay while slowing spending weighs on the outlook for revenue growth and EPS as illustrated by recent earnings reports from Cisco and Deere & Co. Higher interest rates, tight central banks and recessions aren’t good for stocks, especially when they’re near all-time highs across all developed markets.
Visit Traders’ Academy to Learn More About the Retail Sales and Other Economic Indicators.
Disclosure: Interactive Brokers
Information posted on IBKR Campus that is provided by third-parties does NOT constitute a recommendation that you should contract for the services of that third party. Third-party participants who contribute to IBKR Campus are independent of Interactive Brokers and Interactive Brokers does not make any representations or warranties concerning the services offered, their past or future performance, or the accuracy of the information provided by the third party. Past performance is no guarantee of future results.
This material is from IBKR Macroeconomics and is being posted with its permission. The views expressed in this material are solely those of the author and/or IBKR Macroeconomics and Interactive Brokers is not endorsing or recommending any investment or trading discussed in the material. This material is not and should not be construed as an offer to buy or sell any security. It should not be construed as research or investment advice or a recommendation to buy, sell or hold any security or commodity. This material does not and is not intended to take into account the particular financial conditions, investment objectives or requirements of individual customers. Before acting on this material, you should consider whether it is suitable for your particular circumstances and, as necessary, seek professional advice.


Join The Conversation
If you have a general question, it may already be covered in our FAQs. If you have an account-specific question or concern, please reach out to Client Services.