


The 2020s have been a volatile period for U.S. equities. The S&P 500® fell 35% in February and March 2020 before staging a 125% rally between April 2020 and December 2021. It then fell by 27% in the first 10 months of 2022 before rising to a record high early this year. Given these strong gyrations as well as the surge in inflation and interest rates, what should investors make of the S&P 500’s current valuation level? S&P 500 Annual Dividend Index futures can help to shed some light.
In 2015, CME Group launched S&P 500 Annual Dividend Index futures. Initially, the contracts included the current year as well as five subsequent years extending out to 2020. Two years later in 2017, the offering was expanded out to 11 contracts, one for the current year (2017) and 10 for each year in the subsequent decade (2018-2027).
With the launch of these futures, investors were able for the first time in history to observe a futures curve for dividends, a sort of proxy for investor expectations regarding corporate earnings over the coming decade. What is remarkable at the moment is that investors expect near-zero growth in S&P 500 dividend payments over the next decade in nominal terms. After one considers expected inflation, as measured by the difference between the yields on standard U.S. Treasuries and Treasury Inflation Protected Securities (TIPS), investors implicitly price a sharp decline in real (after inflation) dividend payouts over the next decade (Figure 1). How can one reconcile such a pessimistic view on dividends with a stock market that is trading near record highs?
Figure 1: Futures price near-zero growth in dividend payments over the coming decade
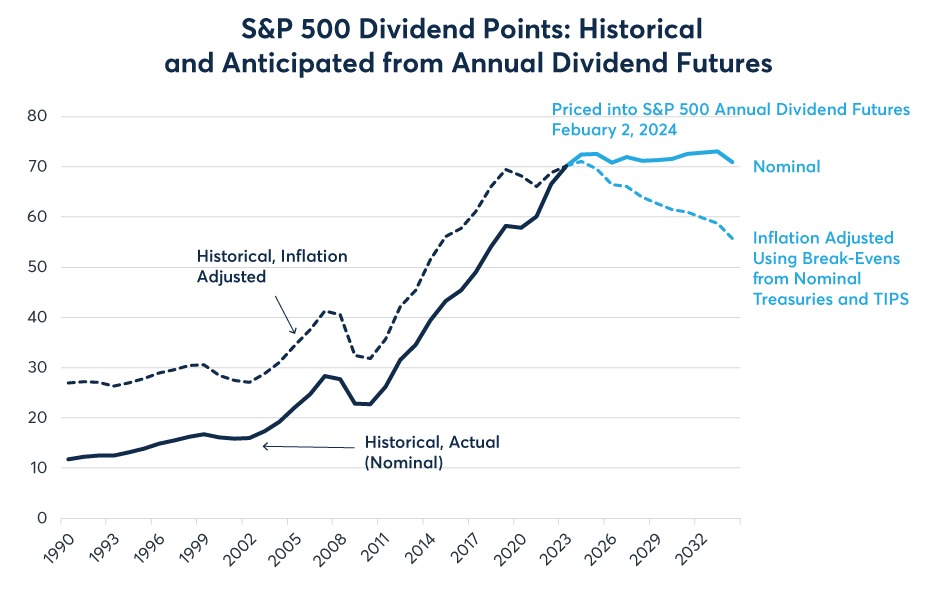
Source: Bloomberg Professional (SPXDIV, ASDZ3, … ASDZ33)
What is also remarkable is how much the S&P 500 has risen relative to expectations of future dividend payments. At the beginning of 2017, the 11 annual dividend index futures added up to an expectation of 497 S&P 500 index points to be paid out in dividends over the next 10 years (2017-2027). As of late January 2024, that number had risen by 29% to 641 for the 10 years ending in late 2034. Meanwhile, the S&P 500 rose from 2,270 to 4,905, a 116% rise over the same period from early 2017 to now (Figure 2). How is it possible that the S&P has a 116% price return when expectations for future dividend payments has risen by only 29%?
Figure 2: Since early 2017, S&P 500 is up 116%, expected dividends up only 29%
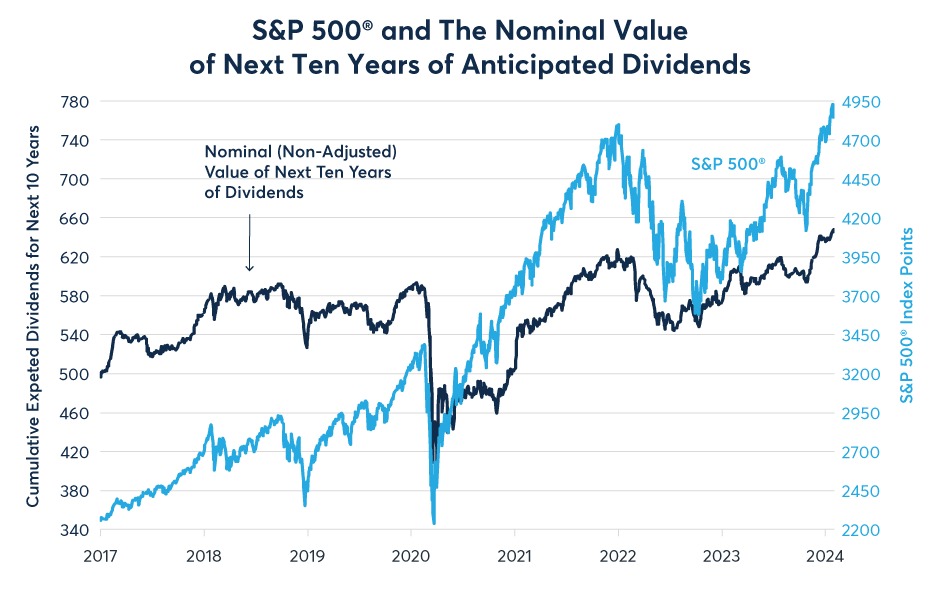
Source: Bloomberg Professional (ASDZ0 … ASDZ30 and SPX)
The explanation breaks into two parts: pre- and post-pandemic onset. In order to analyse the phenomenon, we must convert the raw data series, adding up the value of these contracts, into net present value (NPV). For the NPV calculations we discount the future expected value of the annual dividend payments with U.S. Treasury yields.
Once we have calculated the NPV of the annual dividend index futures, we find that the series moved in almost perfect lockstep with the S&P 500 until March 2020 (Figure 3). The rise in the stock market from 2017 to early 2020 was largely explained by falling bond yields (Figure 4). Lower bond yields increase the NPV of future dividend yields. Then, beginning in April 2020, the S&P 500 soared far beyond what the NPV of dividends might suggest as a fair value for the equity market. If the ratio between the S&P 500 and the NPV of future dividends was today what it was from 2017 to early 2020, the S&P 500 would likely be trading near 3,200 points rather than 4,900 points. So, what caused the divergence?
Figure 3: The S&P moved in lockstep with the NPV of dividends until the Fed restarted QE
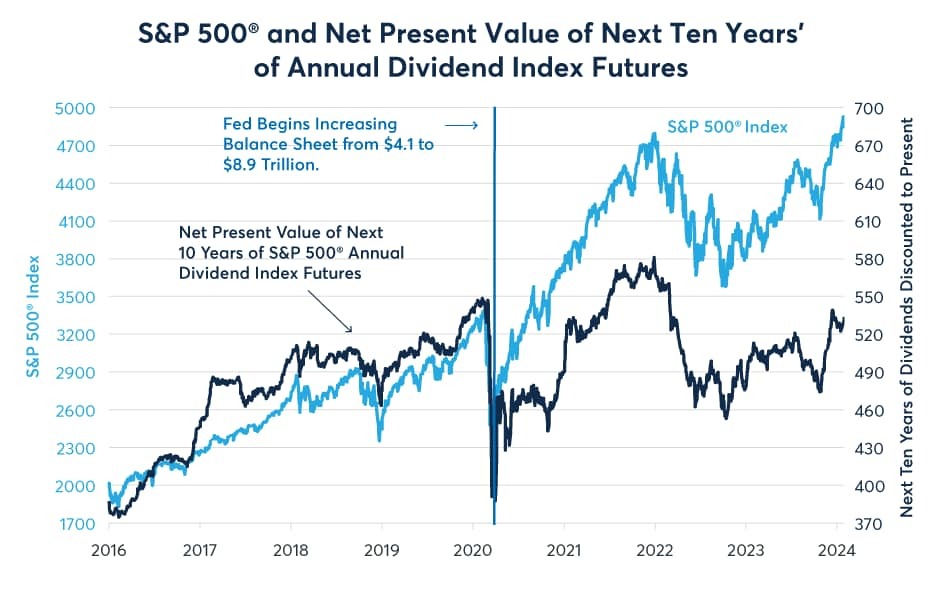
Source: Bloomberg Professional (SPX and ASDZ15-31, GB12, USGG2YR, USGG5YR, USGG10Y), CME Economic Research Calculations
Figure 4: Falling rates raised the NPV of dividends from 2017-2020 but not since
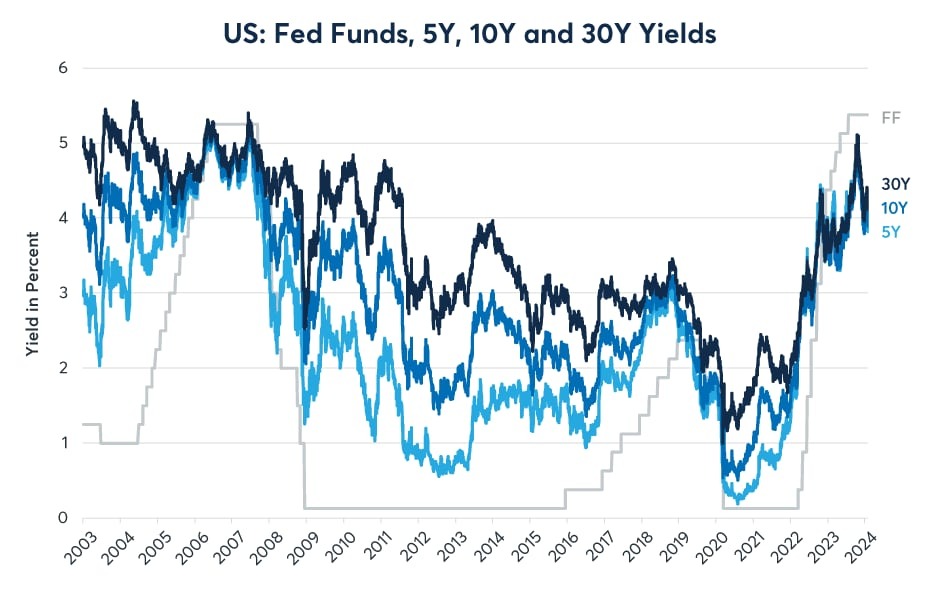
Source: Bloomberg Professional (FDTRMID, USGG2Y, USGG5Y, USGG10Y and USGG30Y)
On March 27, 2020, the U.S. Congress passed the “CARES” Act, a $2.2 trillion package that offered relief to U.S. households and businesses suffering from the economic fallout of the pandemic. Simultaneously, the U.S. Federal Reserve (Fed) in March, April and May 2020, conducted a $3.0 trillion quantitative easing (QE) program. The Fed subsequently continued to expand its balance sheet at a pace of $120 billion per month for the next year and a half before tapering its purchases in early 2022. Meanwhile, Congress passed an additional $900 billion of COVID aid in late December 2020 and an additional $1.9 trillion of aid with the “American Rescue Plan” on March 11, 2021, before passing the $891 billion Inflation Reduction Act in late 2022. All in all, the spending added up to $5.9 trillion and the Fed purchased $4.8 trillion of (largely) U.S. government debt from the markets (with smaller amounts of mortgage bonds and a handful of corporate bonds).
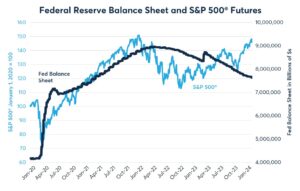
As inflation surged, the Fed began shrinking its balance sheet in June 2022, first at a pace of $47.5 billion per month, and then, as of September 2022, by $95 billion per month (Figure 5). For a while, this, along with a series of 75-basis-point (bps) rate hikes, seemed to put equities under downward pressure. But by late 2022, the equity market had seemingly grown accustomed to higher rates and began a very narrowly led rally dominated by seven or eight technology stocks while most of the rest was left behind. If equities were disturbed by balance sheet shrinkage and higher bond yields, they were overjoyed by the sharp global falloff in inflation rates.
Figure 5: QE may have boosted stocks but QT doesn’t seem to have hurt them (yet)
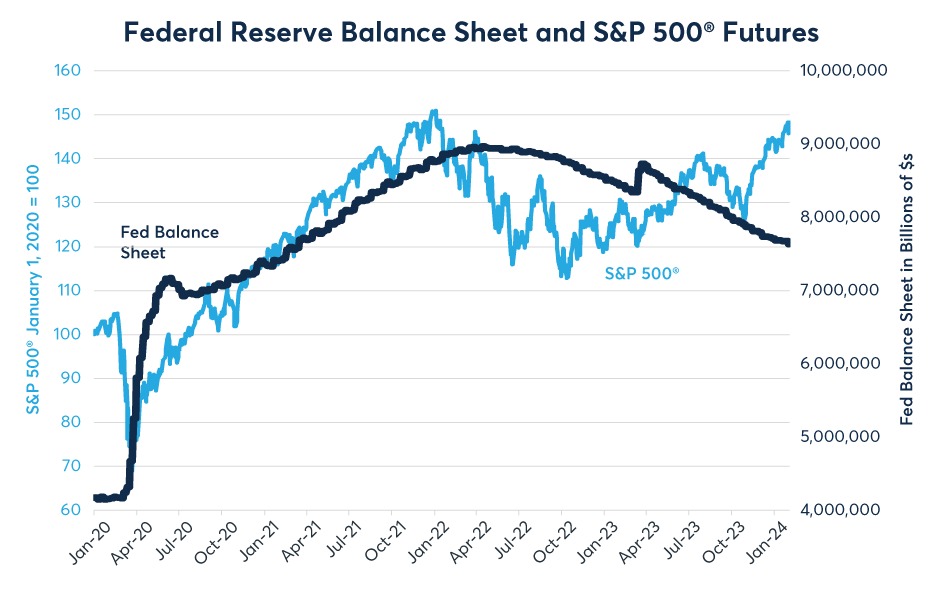
Source: Bloomberg Professional (FARBAST, ES1)
So where does this leave us as of early 2024? For starters, the market’s gloomy expectations regarding future growth in dividend payments might have some justification. For starters, corporate earnings are near a record high as a percentage of GDP. Those earnings have varied from 6% to 13% of GDP. As of the end of Q3 2023, they stood at close to 12% of GDP (Figure 6). So, it will likely be difficult to expand corporate earnings relative to the size of the economy. Secondly, with unemployment currently below 4%, its difficult to see how the economy can grow above trend as is possible when resource utilization is low, say at the bottom of a recession. Finally, with a steeply inverted yield curve and 525 bps of Fed tightening, a recession is a real possibility. The 2008-2009 recession cut dividend payments to investors by 20% while the S&P 500 declined by 60%.
Figure 6: Corporate profits are near a record share of GDP
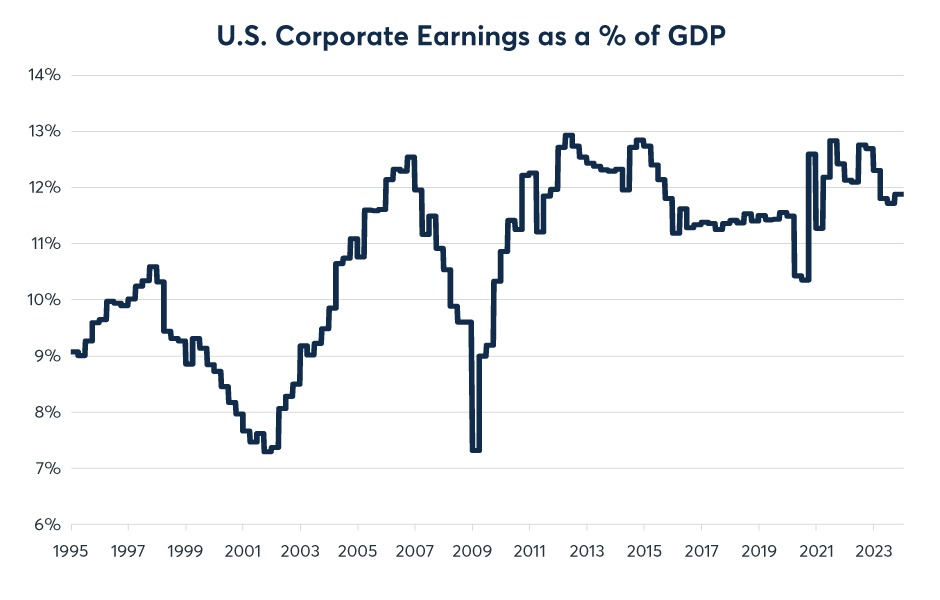
Source: Bloomberg Professional (CPFTTOT and GDP CUR$)
That said, there is also an argument that S&P 500 Annual Dividend Index futures might be too pessimistic. They missed the rise in dividend payments last year. Moreover, as our previous research has shown, dividend payments rose substantially during the high inflation period of the 1970s, well outperforming the equity market).
—
Originally Posted February 7, 2024 – Equities: Lackluster Dividends for the Next Decade?
Disclosure: Interactive Brokers
Information posted on IBKR Campus that is provided by third-parties does NOT constitute a recommendation that you should contract for the services of that third party. Third-party participants who contribute to IBKR Campus are independent of Interactive Brokers and Interactive Brokers does not make any representations or warranties concerning the services offered, their past or future performance, or the accuracy of the information provided by the third party. Past performance is no guarantee of future results.
This material is from CME Group and is being posted with its permission. The views expressed in this material are solely those of the author and/or CME Group and Interactive Brokers is not endorsing or recommending any investment or trading discussed in the material. This material is not and should not be construed as an offer to buy or sell any security. It should not be construed as research or investment advice or a recommendation to buy, sell or hold any security or commodity. This material does not and is not intended to take into account the particular financial conditions, investment objectives or requirements of individual customers. Before acting on this material, you should consider whether it is suitable for your particular circumstances and, as necessary, seek professional advice.


Join The Conversation
If you have a general question, it may already be covered in our FAQs. If you have an account-specific question or concern, please reach out to Client Services.