


This week will be the capstone of 2023 because whatever happens this week will be a send-off message as 2024 approaches. This week will feature CPI, PPI, and retail sales on the economic front. A 3,10, and 30-year Treasury auctions and central bank meetings from the Fed, ECB, and BOE. To finish it off, it will be quadruple witching options expiration on Friday. Did I miss anything? Next week will perhaps be the penultimate central bank meeting, the Bank of Japan.
Auctions
The week will kick off Monday with a $50 billion auction of 3-year Treasury notes at 11:30 AM, followed by a $37 billion reopening of the 10-year Treasury notes the same day at 1 PM ET. Then, on Tuesday, the Treasury will auction a $21 billion reopening of the 30-year Treasury bond at 1 PM ET.
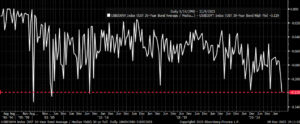
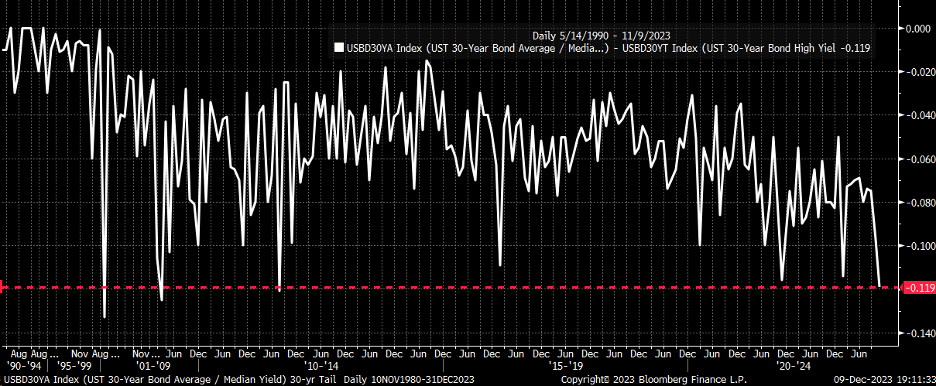
The last time the 30-year was auctioned off in November, it had its largest tail going back to 2011, during the debt downgrade.
CPI
Of course, before that, the 30-year auction will be the inflation data, and it is not clear to me that the CPI report will hold any major surprises; expectations are for the inflation gauge to rise 0.0% m/m in November flat to October while climbing by 3.1% y/y down from 3.2% y/y. Core CPI is expected to climb by 0.3% m/m, up from 0.2%, and 4.0% y/y flat with October.
The Fed
I don’t see the Fed endorsing rate cuts, and it will stick to its being premature to talk about rate cuts now. My guess is that the message will sound very similar to what Powell gave in his speech before the blackout period, which the market ignored. That message will be conveyed through Powell and the dot plots, with the 2024 median remaining unchanged, 2025 increased, and possibly the longer-run rate pushed up, too. (See my latest YouTube video: The Fed May Shock Rates Higher This Week)
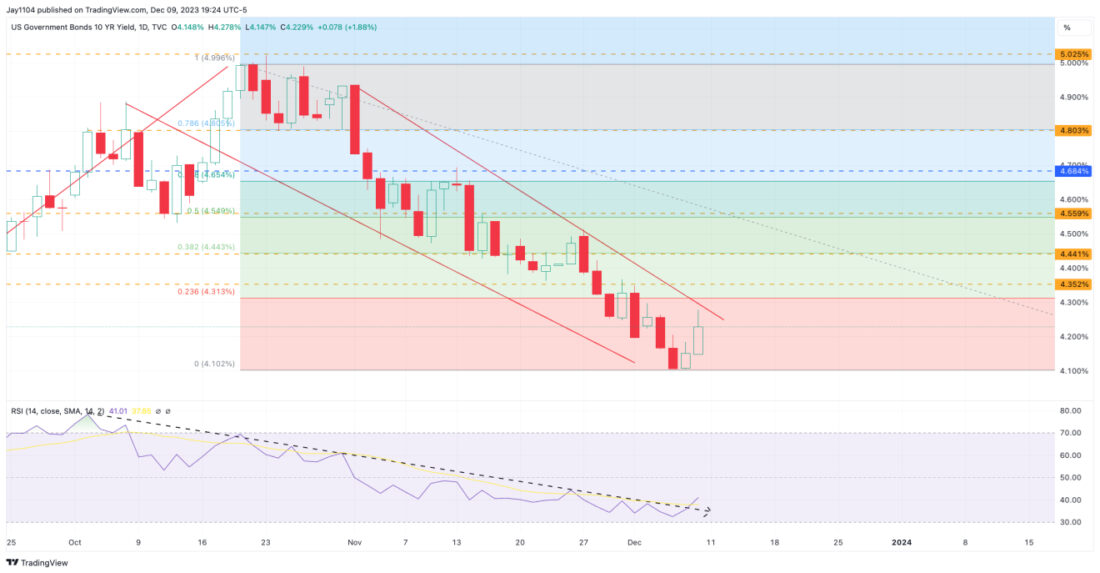
I think that ultimately, we will see a rebound in long-end rates. I’m not sure it means new highs, but a retracement seems right. The 10-year has broken its downtrend on the relative strength index and is approaching the upper end of a downtrend. But a 61.8% retracement of the recent drop in rates could easily take the 10-year back to 4.70%
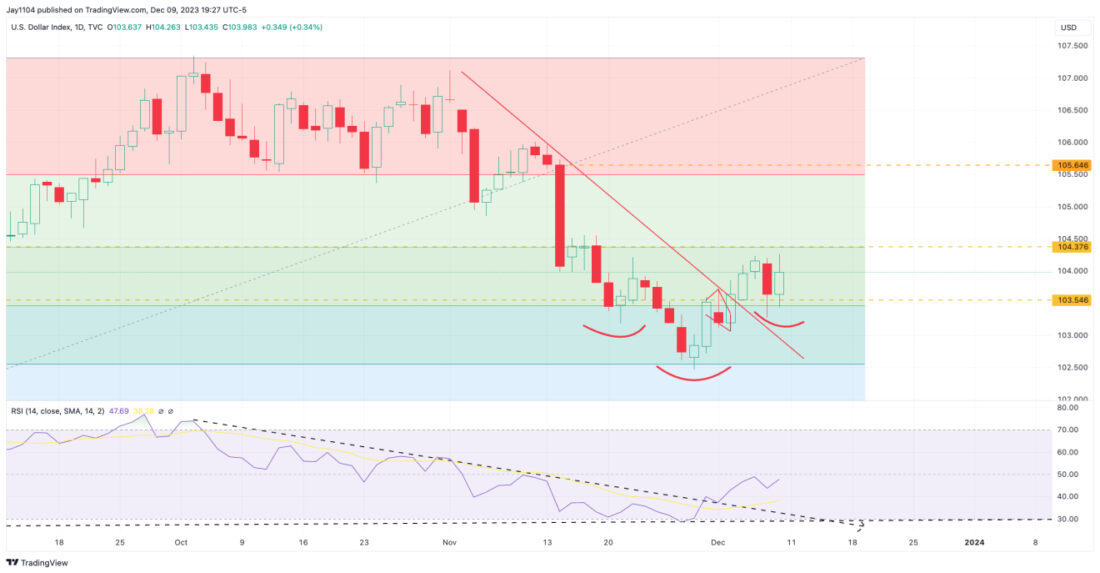
Meanwhile, the dollar index also looks poised to go higher from current levels. There appears to be an inverse head and shoulders pattern in the DXY. The dollar bounced sharply off the 61.8% retracement level and now has an RSI that appears to be turning higher longer-term and has recently broken above a short-term downtrend. A push above 104.5, back on its way to 105.60.
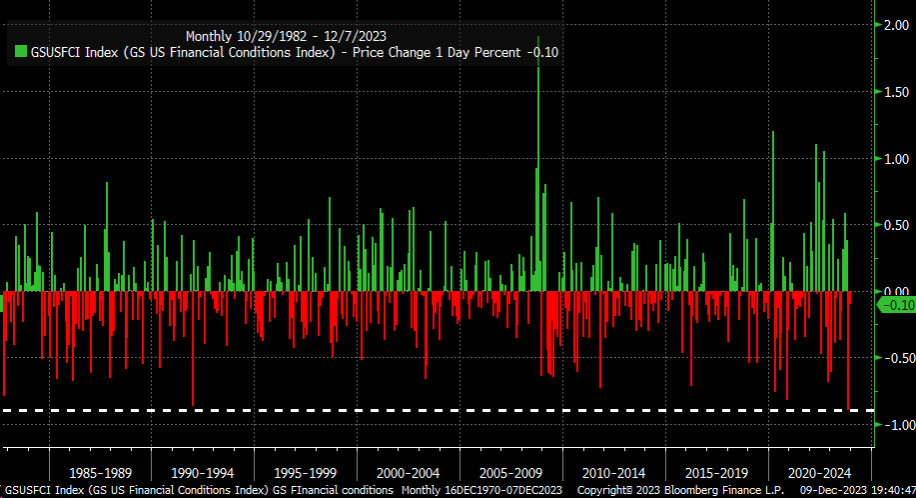
Higher rates and a stronger dollar will certainly be needed for financial conditions to tighten, especially since the Fed decided to include how tighter financial conditions could weigh on economic activity in its statement in November. The GS financial conditions eased by its largest amount ever in November.
Markets
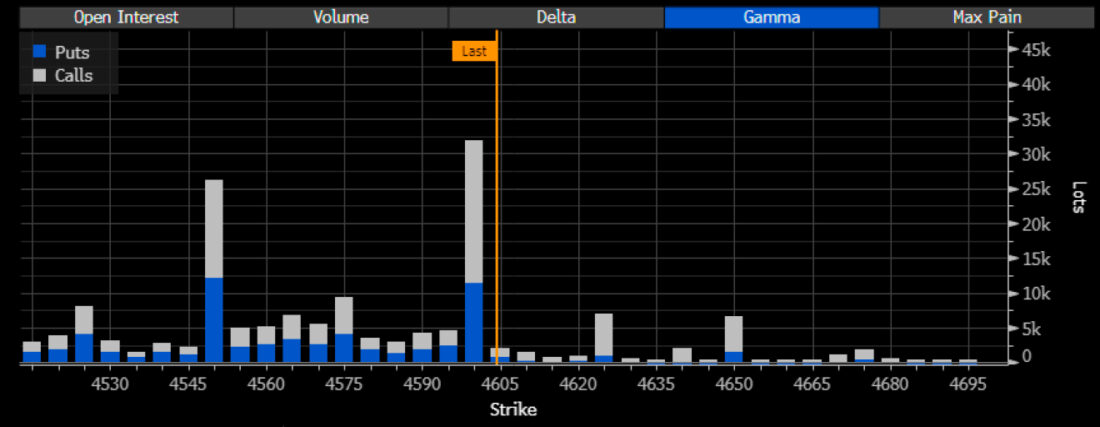
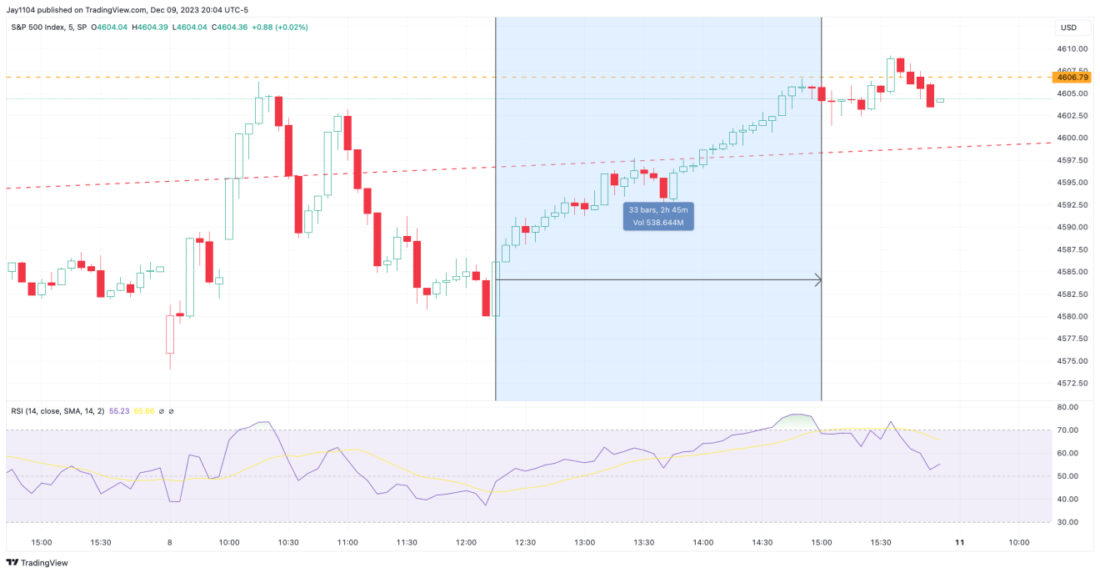
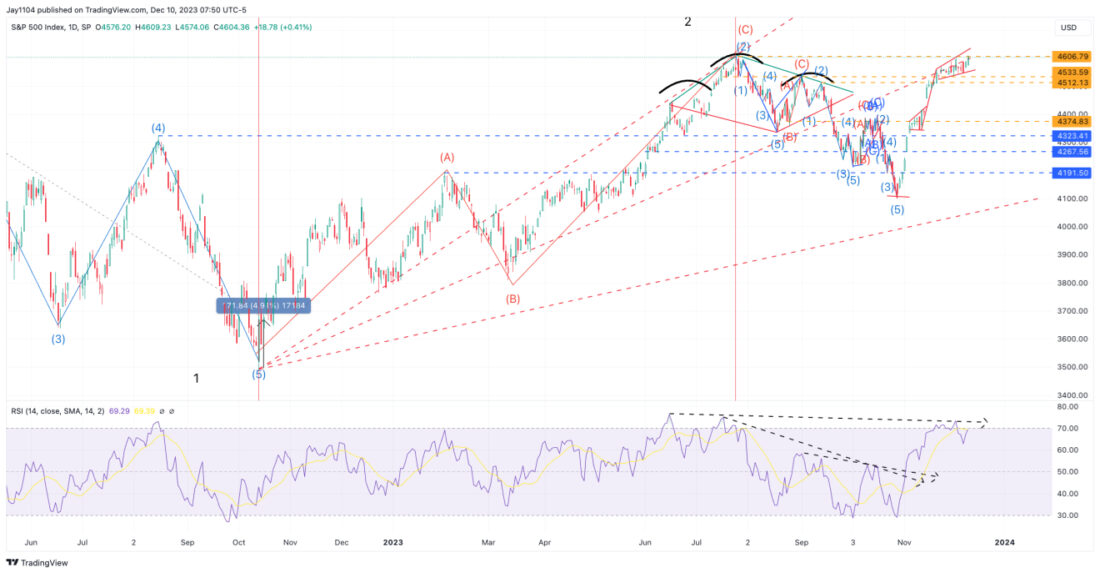
Meanwhile, the S&P 500 moved higher on Friday and just eeked past its July highs. If we move lower on Monday, it won’t matter much, but if we continue to go higher, I will have to redraw my wave count and think harder about it. But logically, there are a lot of reasons why stocks shouldn’t continue to move higher, with the most obvious reason being the call wall for this coming Friday at 4,600. As far as I know, that level has not changed, and as noted on Thursday, it was likely to bring out call sellers.
According to Goldman, the corporate blackout window begins this Monday, with the $5 billion daily VWAP machine going into hibernation until mid-January. If Friday’s price action seemed mechanical, the above probably had a lot to do with it since buybacks stopped at 3 PM ET, which was exactly when the mechanical move ended.
Meanwhile, once we get past opex on Friday, 37% of S&P 500 gamma will come off, which could increase volatility in the market.
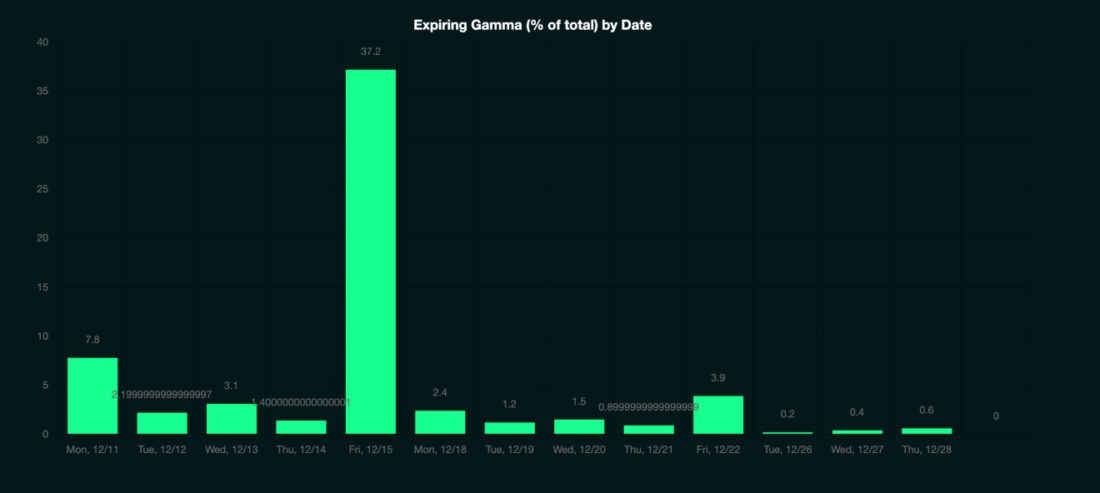
The loss of gamma and the absence of the buybacks set the market up for more volatility, especially during multiple central bank meetings. The big central bank meeting will also be the BOJ, which will be next week. If the BOJ decides to move and come out of its negative interest rate policy, it will start strengthening the yen and moving it lower, which does put at risk stability because it would likely start the unwind of the carry of trade, and it is hard to measure just how much impact that would have.
The yen has already started to strengthen in anticipation of a change in policy stance from the BOJ.
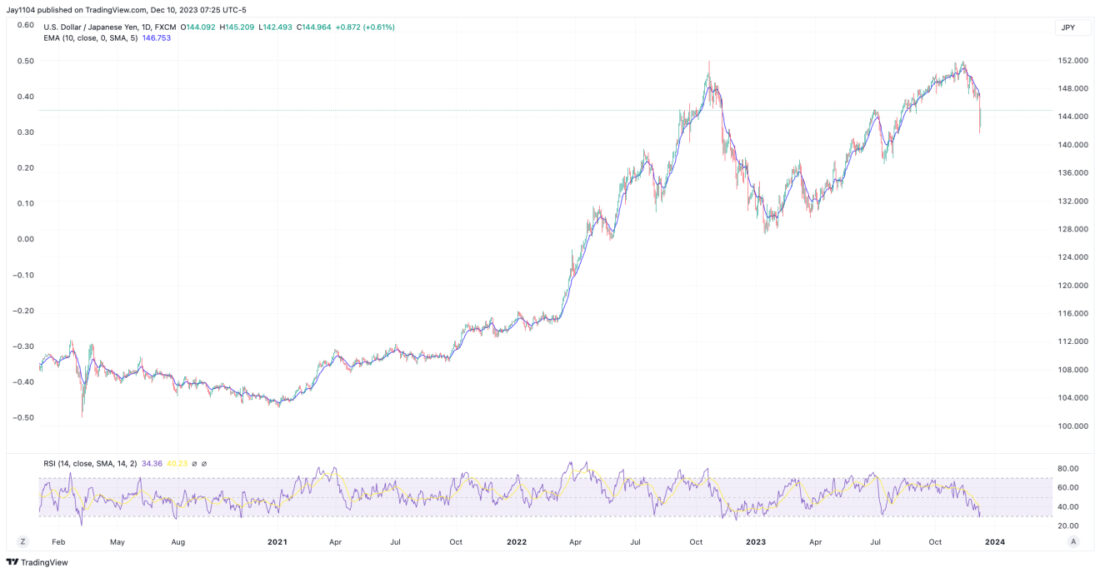
We can use the Nikkei as a proxy because if the rally in the Nikkei has been due to the weaker yen and not due to a true bull market, then the stronger yen will sink stocks in Japan. After all, the leg higher in Japan starting in March was due to the weakening of the Yen.
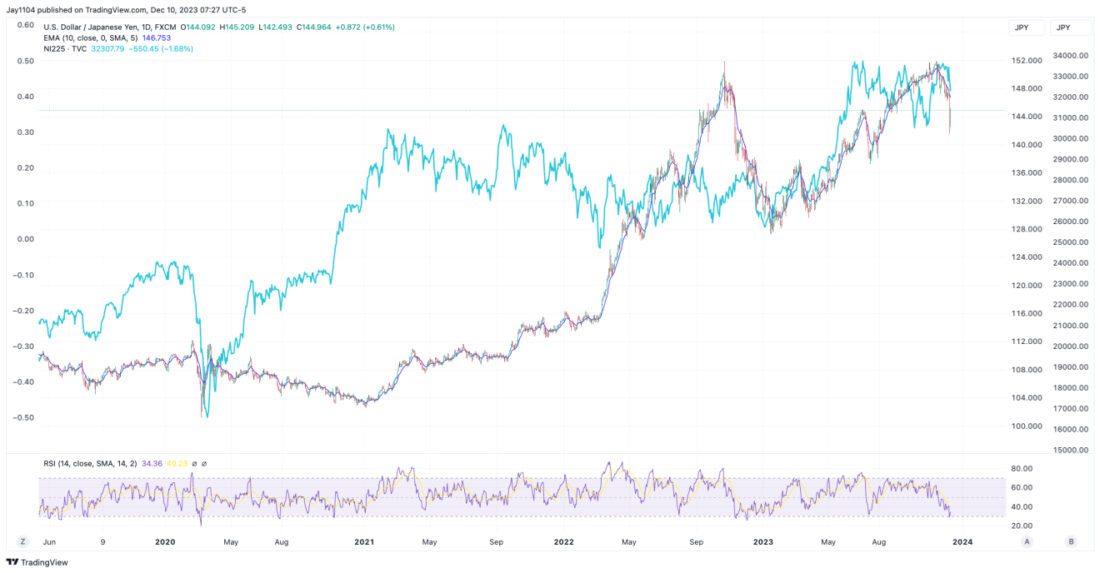
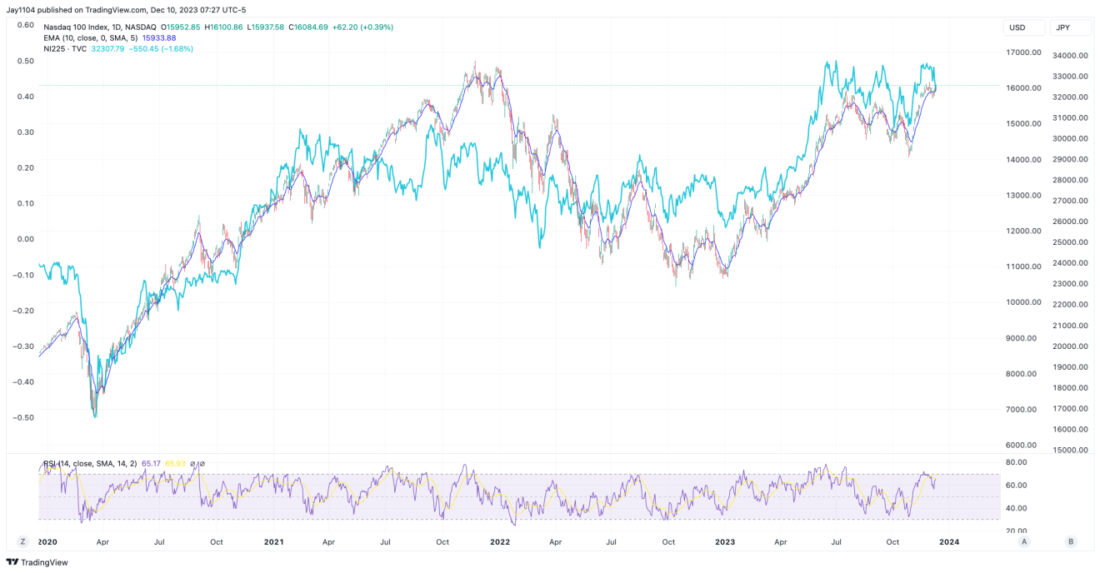
Coincidence or not, the move higher in the Nikkei looks identical to the rally we have seen in the NASDAQ over that same time period.
As does the rally in the S&P 500.
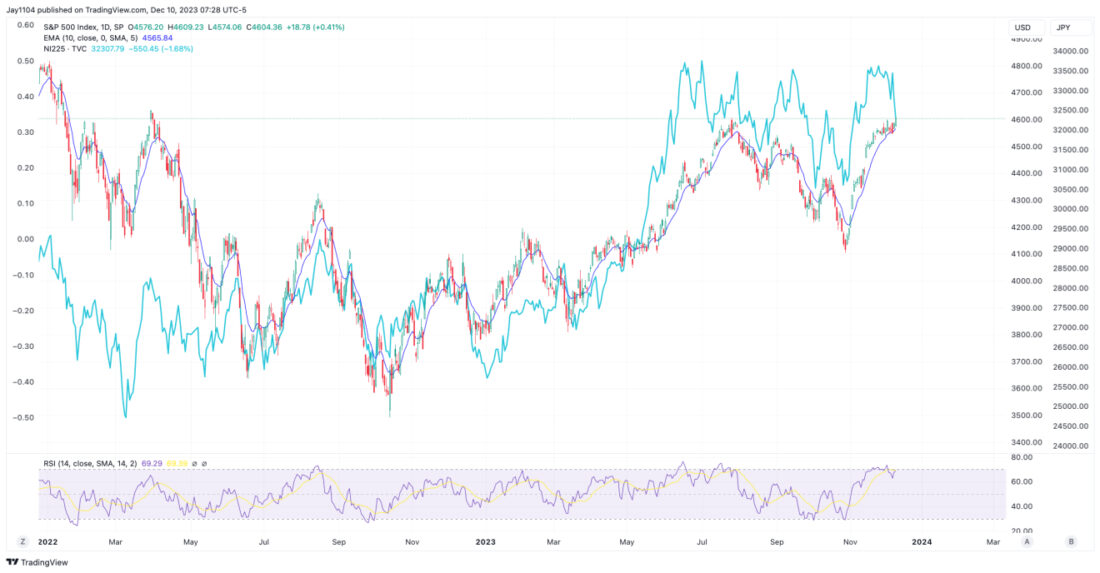
Meanwhile, the 1/3 speed resistance line from the October 2022 low continues to offer meaningful resistance for the S&P 500, and the diamond pattern, on my part, appears to be incorrect unless we come back down quickly on Monday. However, the rising broadening wedge is still part of the large pattern, and those rising broadening wedges tend to be bearish patterns; there is also a bearish divergence pattern that is present in the RSI. So, my thought process that the S&P 500 returns to 4,100 and fills the gap is still valid at this point. Friday’s rally didn’t do enough damage to kill the idea completely.
—
Originally Posted December 10, 2023 – Here’s What Could Rattle Markets The Week of December 11, 2023
Charts used with the permission of Bloomberg Finance L.P. This report contains independent commentary to be used for informational and educational purposes only. Michael Kramer is a member and investment adviser representative with Mott Capital Management. Mr. Kramer is not affiliated with this company and does not serve on the board of any related company that issued this stock. All opinions and analyses presented by Michael Kramer in this analysis or market report are solely Michael Kramer’s views. Readers should not treat any opinion, viewpoint, or prediction expressed by Michael Kramer as a specific solicitation or recommendation to buy or sell a particular security or follow a particular strategy. Michael Kramer’s analyses are based upon information and independent research that he considers reliable, but neither Michael Kramer nor Mott Capital Management guarantees its completeness or accuracy, and it should not be relied upon as such. Michael Kramer is not under any obligation to update or correct any information presented in his analyses. Mr. Kramer’s statements, guidance, and opinions are subject to change without notice. Past performance is not indicative of future results. Neither Michael Kramer nor Mott Capital Management guarantees any specific outcome or profit. You should be aware of the real risk of loss in following any strategy or investment commentary presented in this analysis. Strategies or investments discussed may fluctuate in price or value. Investments or strategies mentioned in this analysis may not be suitable for you. This material does not consider your particular investment objectives, financial situation, or needs and is not intended as a recommendation appropriate for you. You must make an independent decision regarding investments or strategies in this analysis. Upon request, the advisor will provide a list of all recommendations made during the past twelve months. Before acting on information in this analysis, you should consider whether it is suitable for your circumstances and strongly consider seeking advice from your own financial or investment adviser to determine the suitability of any investment.
Disclosure: Mott Capital Management
Mott Capital Management is the portfolio manager for one portfolio offered by Interactive Advisors. Interactive Advisors clients do not invest directly with the Portfolio Managers like Mott Capital Management, and the Managers do not have discretionary trading authority over Interactive Advisors client accounts. The Portfolio Managers on the Interactive Advisors platform simply license their trade data to Interactive Advisors, which then allows its clients to have the same strategy and trading decisions mirrored in their accounts if the Portfolio is in line with their risk score. Portfolio Managers like Mott Capital Management implement their trading philosophy and strategy without knowing the identity of Interactive Advisors’ clients or taking into account these clients’ individualized circumstances.
Mott Capital Management has entered into a Portfolio Manager License Agreement with Interactive Advisors pursuant to which it provides trading data IA uses to offer a portfolio to its investment advisory clients. Mott Capital Management is not affiliated with any entities in the Interactive Brokers Group.
Interactive Advisors is an affiliate of Interactive Brokers LLC.
Pursuant to the Investment Management Agreement between Interactive Advisors and its clients, all brokerage transactions occur through Interactive Brokers LLC, an affiliate of Interactive Advisors. The use of an affiliate for brokerage services represents a potential conflict of interest as Interactive Brokers LLC is paid a commission on trades executed on behalf of Interactive Advisors. Interactive Brokers LLC does not consider this conflict material as it does not sell, solicit, recommend, trade against or otherwise attempt to induce Interactive Advisors to place any orders in any products. Interactive Advisors does not offer services through any other broker-dealer. All trading by Interactive Advisors is self-directed. Interactive Advisors clients acknowledge this potential conflict of interest and authorize Interactive Advisors to execute transactions through Interactive Brokers LLC when they open an Interactive Advisors account. Clients should consider the commissions and other expenses, execution, clearance, and settlement capabilities of Interactive Brokers LLC as a factor in their decision to invest in an Interactive Advisors Portfolio. Interactive Advisors believes it satisfies its best execution obligation by trading its clients’ trades through Interactive Brokers LLC. While there can be no assurance that it will in fact achieve best execution, Interactive Advisors does periodically monitor the execution quality of transactions to ensure that clients receive the best overall trade execution pursuant to regulatory requirements.
Disclosure: Interactive Brokers
Information posted on IBKR Campus that is provided by third-parties does NOT constitute a recommendation that you should contract for the services of that third party. Third-party participants who contribute to IBKR Campus are independent of Interactive Brokers and Interactive Brokers does not make any representations or warranties concerning the services offered, their past or future performance, or the accuracy of the information provided by the third party. Past performance is no guarantee of future results.
This material is from Mott Capital Management and is being posted with its permission. The views expressed in this material are solely those of the author and/or Mott Capital Management and Interactive Brokers is not endorsing or recommending any investment or trading discussed in the material. This material is not and should not be construed as an offer to buy or sell any security. It should not be construed as research or investment advice or a recommendation to buy, sell or hold any security or commodity. This material does not and is not intended to take into account the particular financial conditions, investment objectives or requirements of individual customers. Before acting on this material, you should consider whether it is suitable for your particular circumstances and, as necessary, seek professional advice.
Disclosure: Forex
There is a substantial risk of loss in foreign exchange trading. The settlement date of foreign exchange trades can vary due to time zone differences and bank holidays. When trading across foreign exchange markets, this may necessitate borrowing funds to settle foreign exchange trades. The interest rate on borrowed funds must be considered when computing the cost of trades across multiple markets.


Join The Conversation
If you have a general question, it may already be covered in our FAQs. If you have an account-specific question or concern, please reach out to Client Services.