


Strong Hiring Trends Keep The Fed Restrictive
The Federal Reserve’s aggressive monetary policy tightening is slowly helping to moderate inflation, but it has more work to do to tame price increases in the sticky services components which will likely require further slowing in the labor market. Wage pressures have slowed, however, partially because of a large increase in prospective workers seeking employment. Meanwhile, consumer spending and economic growth have performed surprisingly well but we expect both to slow materially into next year as savings are depleted and the effects of the Fed’s actions become more apparent. Monetary policy operates with long and variable lags and is likely to weigh as 525 basis points (bps) of interest rate hikes with the possibility of one more on the way are digested. Geopolitics are also a concern, driving oil prices higher which serves to slow inflationary progress while constraining corporate and household budgets. These factors point to growing risks of the economy lapsing into stagflation, an environment of slower economic growth alongside higher than trend inflation.
The rate of overall inflation remains high but has moderated against the backdrop of slowing consumption and tighter financial conditions. The Federal Reserve’s (the Fed) preferred gauge of inflation, the core PCE, is at 3.9% as of August, nearly double the Fed’s 2% target. The Fed may raise the federal funds rate from its 5.38% level in order to dampen inflationary pressures further. Odds of 8% and 30% favor a 25-bp hike at the November and December meeting, with market participants expecting the next possible hike to be the final one of the cycle, leaving the terminal rate at 5.63%, consistent with the Fed’s Summary of Economic Projections.
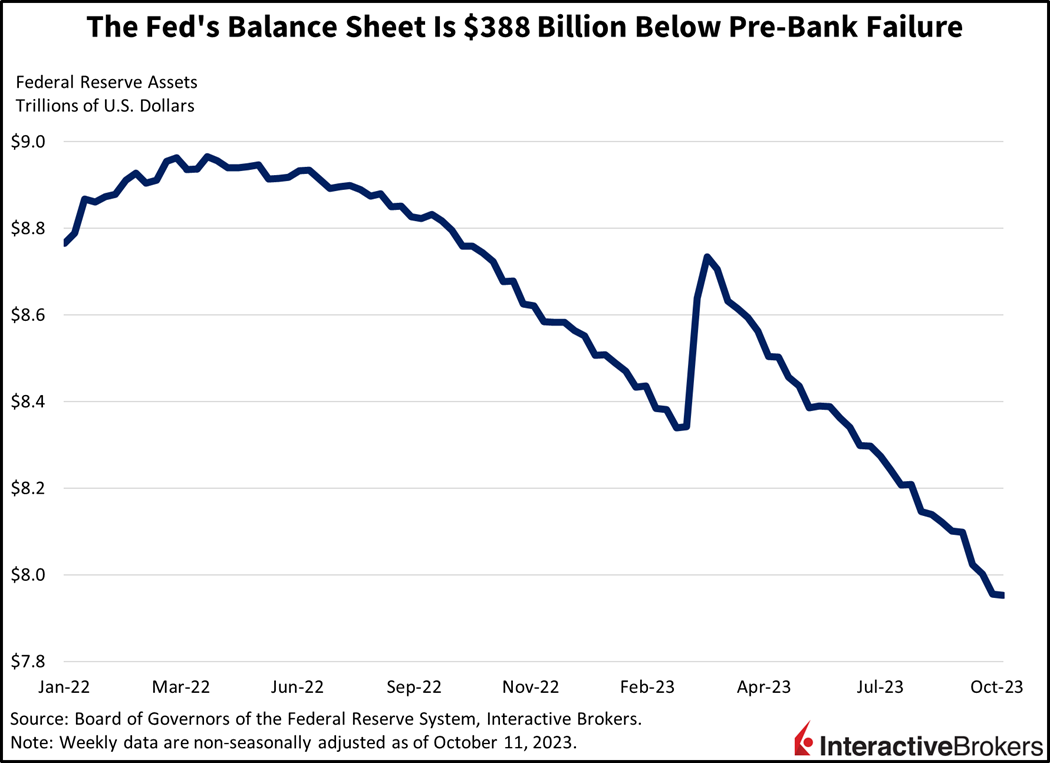
In addition to rate hikes, the Fed has increased the pace of its balance sheet reduction program to a monthly cap of $95 billion from $47.5 billion, further constraining the money supply and financial conditions alike. During the two weeks ending March 22nd, however, bank troubles led the Fed to inject $392 billion into the economy, a result of the emergency Bank Term Funding Program. While the emergency program is in place for at least one year, its use has stabilized and the balance sheet has since contracted to a new yearly low, roughly $388 billion less than the level that coincided with significant regional bank stress in March. The Fed has expressed a strong commitment of keeping rates higher for longer until it sees convincing evidence of inflation returning to the 2% target, even as economic conditions slow. Tighter lending conditions at banks in the aftermath of the March scares are also likely to weigh on economic and employment growth. The week ending March 22nd featured the sharpest contraction in lending and deposits since the 2008 financial crisis. Lending conditions and deposit trends have yet to recover to pre-bank failure levels, as the banking sector remains under significant stress.
Leading economic indicators point to 3rd quarter GDP growth of 2.3%.
Below, we examine what leading economic indicators portent to our picture of the evolving economic landscape. This is our view at the moment and our projections may be confirmed or we may have to adjust them as different, new information, including freshly released economic indicators, are made available.
Initial Unemployment Claims
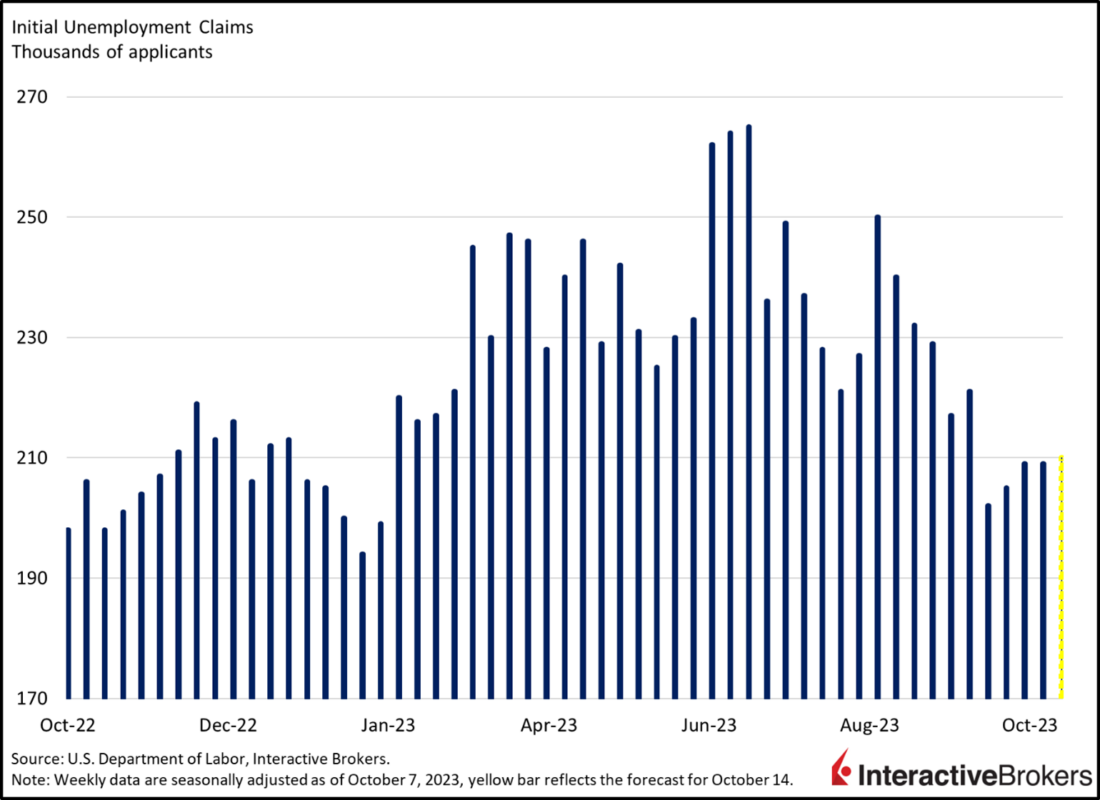
With the Fed aggressively hiking interest rates and consumer spending slowing, the labor market is showing initial signs of softening. Initial unemployment claims have been volatile in the last few months against the backdrop of slower revenue growth, persistent cost pressures, weakening margins, declining profitability and tighter financial conditions. The tech sector specifically has laid off more than 404,000 workers in 2022 and 2023 while banks and certain companies in other sectors have also implemented layoffs and hiring freezes. Most companies, however, are hoarding labor due to difficulties with hiring during the pandemic and the current labor shortage resulting, in large part, from historically low labor force participation. The low participation rate results in large part from Americans retiring early during the depths of the COVID-19 pandemic, discouraged workers upset about income and growth prospects, a skills mismatch as companies struggle to match job openings with job applicants and to a lesser extent from working age Americans on the sidelines due to long-haul Covid. Participation has climbed in 2023 however, as Americans flock back to the labor force for income to offset the adverse pressure of persistent inflation, elevated financing costs and reduced credit availability. Still, labor force participation remains below pre-pandemic levels.
We expect the economic slowdown, tighter credit conditions and higher interest rates to lead to modestly higher unemployment in 2024 as tighter monetary policy gets digested, financial conditions tighten and pandemic-era savings become depleted. Also, persistent inflation has emerged as a new generational headwind, compelling consumers to trade down and make difficult budgetary decisions. During times of monetary policy tightening and higher interest rates, business revenue tends to slow because financing the production of goods and services becomes more expensive, leading to possible layoffs as businesses attempt to sustain profit margins. An increase in initial unemployment claims would point to the following changes: lower consumption/demand, lower inflation, lower long-term interest rates and lower GDP growth. If initial unemployment claims drop significantly, demand will rise, inflation will rise, long-term interest rates will rise and GDP growth will rise. The next unemployment claim release will be on October 19th. It is currently expected to be 210,000, a slight increase from the previous week’s reading of 209,000. Should the actual number be much lower or higher, we would have to adjust our outlook by slightly raising or lowering our estimate for economic indicators and ultimately our estimate for GDP.
Retail Sales
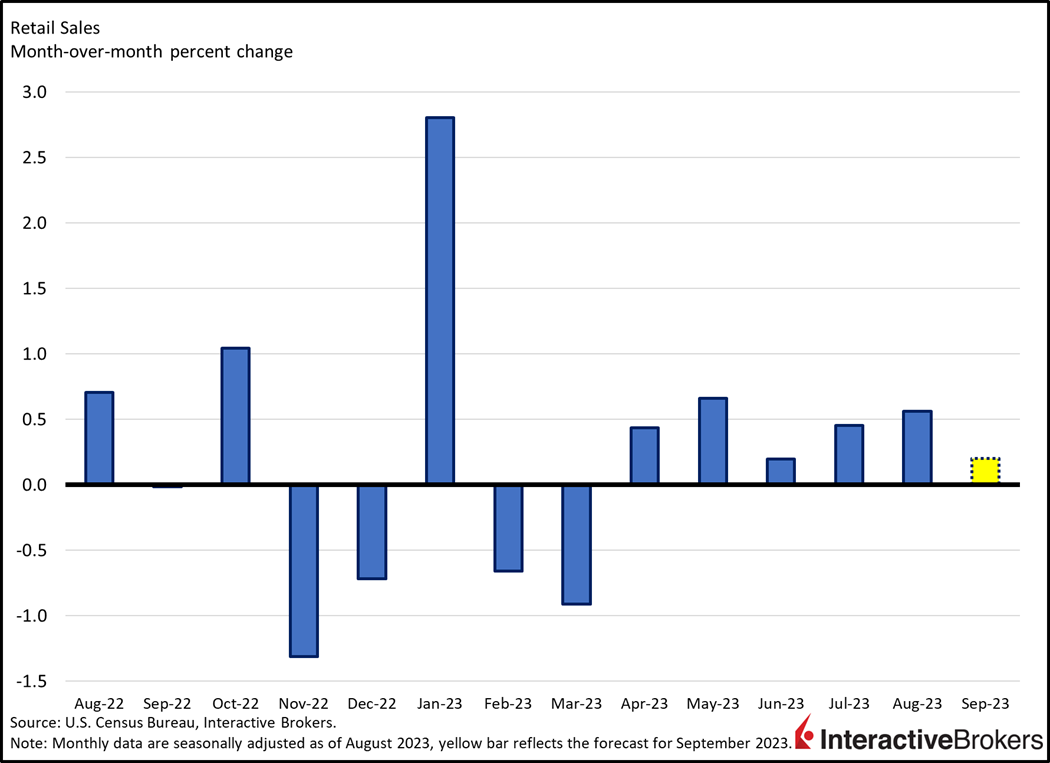
Consumer spending has performed well despite higher interest rates, loftier prices, reduced credit availability and less job openings. The momentum of consumption has slowed, however, as record monetary and fiscal stimulus from the pandemic era wanes. Some recent months have even featured contractions when accounting for inflation. The loss of momentum is especially true with goods rather than services, with some recent gauges of manufacturing activity showing the sharpest contractions since the heights of the COVID-19 pandemic in April 2020.
Consumer spending is likely to slow further as pandemic-era savings dwindle, labor market opportunities lessen and the Fed continues to tighten monetary policy, dampening demand, especially for big ticket items. Also, persistent inflation has emerged as a new generational headwind, constraining consumer spending on a relative basis. During times of monetary policy tightening and higher interest rates, consumption tends to slow because goods and services become more expensive to finance. A continued slowing or contraction of retail sales would point to the following changes: lower consumption/demand, lower inflation, lower long-term interest rates and lower GDP growth. If retail sales growth ramps up again due to monetary policy easing, consumption/demand will rise, inflation will rise, short-term interest rates will fall and GDP growth will rise. The next month’s release will be on October 17th. It is currently expected to increase to $698.95 billion, a 0.2% month-over-month gain, increasing from the previous month’s $697.56 billion, a 0.6% gain from July. Should the actual number be much lower or higher, we would have to adjust our outlook by slightly raising or lowering our estimate for economic indicators and ultimately our estimate for GDP.
Consumer Sentiment
Consumer sentiment is bouncing along low levels as interest rates remain high, labor market opportunities wane and inflation persists. Sentiment was trending higher until the Fed started raising rates in 2022 as it was previously supported by strong monetary and fiscal stimulus, which have been reduced. Also, persistent inflation has emerged as a new headwind, weakening consumer sentiment on a relative basis. Since June 2022 however, the indicator has found a floor, driven by falling gasoline prices, stabilizing interest rates and rising asset prices although it remains at historically low levels still. During times of monetary policy tightening and higher interest rates, sentiment tends to weaken because employment conditions and business revenue growth generally soften while goods and services become more expensive to finance, hampering consumers. Continued low levels of consumer sentiment would point to the following changes: lower consumption/demand, lower inflation, lower long-term interest rates and lower GDP growth. If consumer sentiment ramps up again due to monetary policy easing, consumption will rise, demand will rise, inflation will rise, short-term interest rates will fall and GDP growth will rise. The next month’s release will be on November 10th. It is currently expected to be 62, decreasing slightly from the previous month’s reading of 63, a sharp decline from September’s 68.1 level. Should the actual number be much lower or higher, we would have to adjust our outlook by slightly raising or lowering our estimate for economic indicators and ultimately our estimate for GDP.
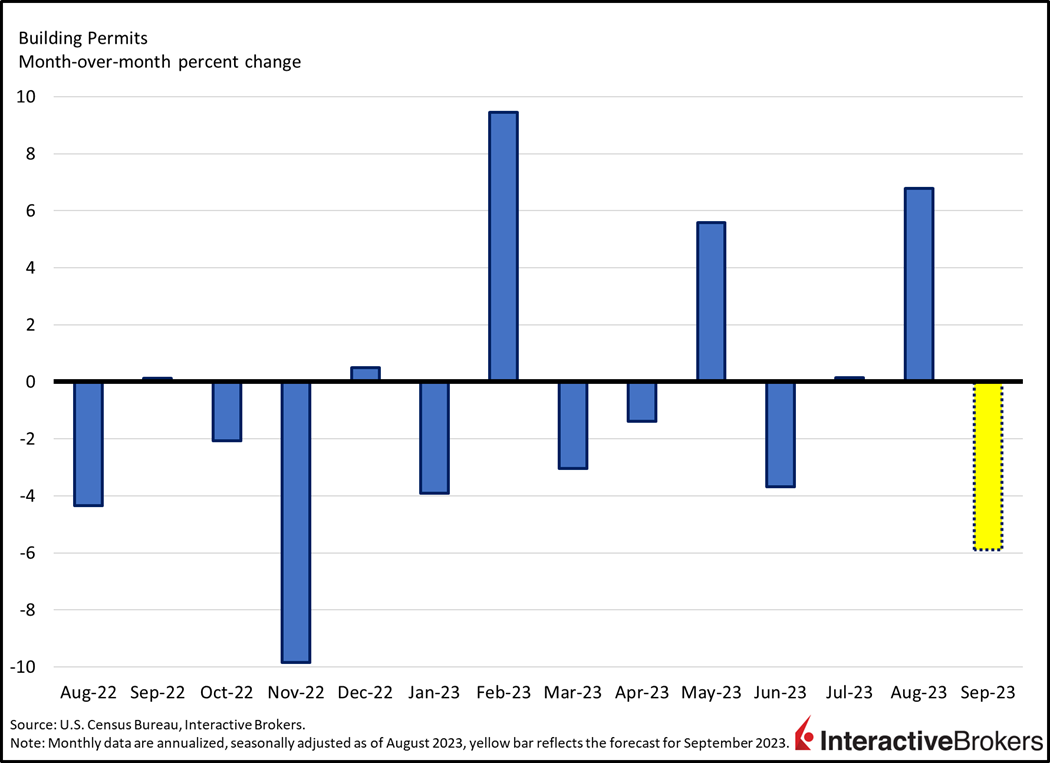
Building Permits
The real estate industry is weakening dramatically under the weight of near all-time low home affordability driven by high prices and high mortgage rates. Building permits are falling against the backdrop of tighter financial conditions and a lack of homebuyers. After growing at a strong level for most of the past three years, supported by strong monetary policy stimulus and an increased demand for housing outside of urban areas due to the pandemic, building permits have slowed and are now in contraction territory. Expectations of further slowing is expected as the Fed continues to tighten monetary policy, slowing demand in this capital intensive, economically cyclical, interest-rate-sensitive industry. Significant home price growth has pressured affordability to near its worst level in history, leading to significant contractions in mortgage applications. Still, low levels of inventory and little incentive for existing homeowners to move to new homes with much higher interest rates have increasingly driven prospective home buyers into the new home category, providing homebuilders with motivation. During times of monetary policy tightening and higher interest rates, however, building tends to slow because real estate becomes much more expensive to finance. A continued contraction in building permits would point to the following changes: lower consumption/demand, lower inflation, lower long-term interest rates and lower GDP growth. If building permit growth ramps up again due to monetary policy easing, demand will rise, inflation will rise, short-term interest rates will fall and GDP growth will rise. The next month’s release will be on October 18th. It is currently expected to come in at 1.45 million seasonally adjusted annualized units, a 5.9% decline from the previous month’s 1.541 million, a 6.8% gain from July. Should the actual number be much lower or higher, we would have to adjust our outlook by slightly raising or lowering our estimate for economic indicators and ultimately our estimate for GDP.
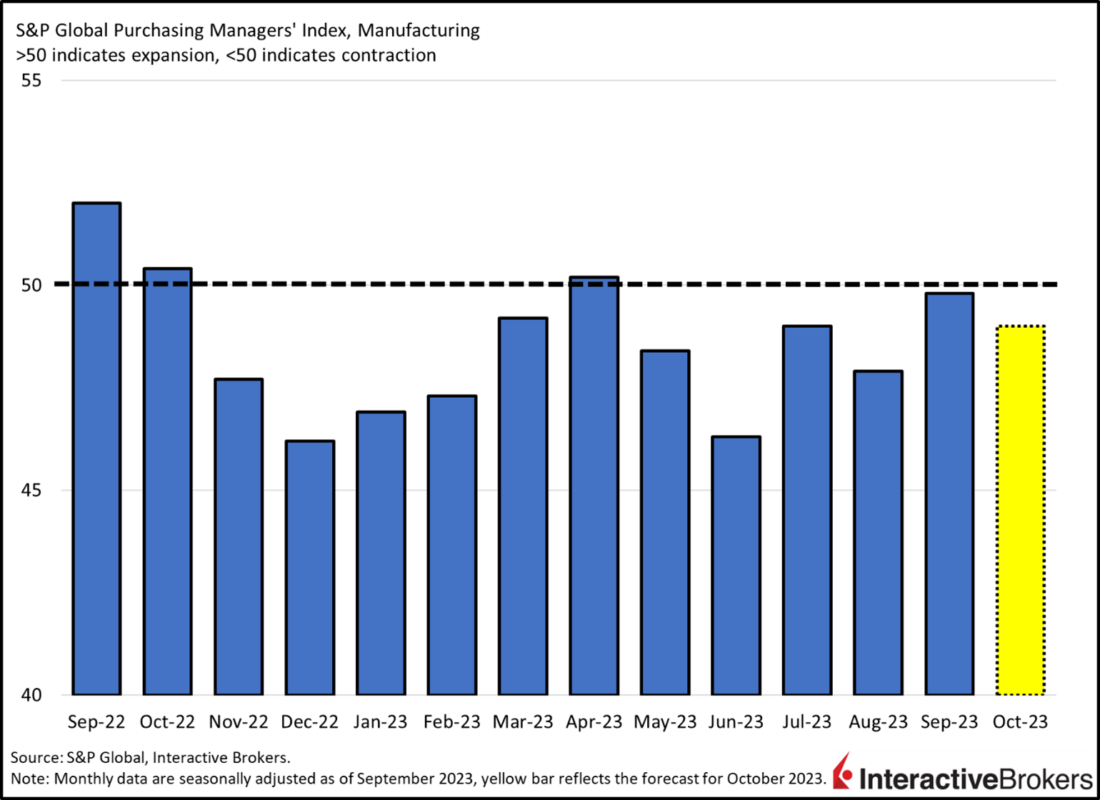
PMI-Manufacturing
Tighter financial conditions and slowing consumption are contributing to sharp declines in manufacturing activity. After expanding at a strong level for much of the past three years, supported by strong monetary and fiscal policy stimulus and increased demand for manufactured goods rather than services due to the pandemic, manufacturing activity has been in contraction territory for most of the past eleven months. New orders, a critical component of the PMI, has weighed on the headline figure, signaling depressed demand for big ticket items, historically a leading indicator of not just the manufacturing sector, but of the entire economy. Expectations of continued slowing is expected as the Fed continues to tighten monetary policy, slowing demand in this capital intensive, economically cyclical, interest-rate-sensitive industry. During times of monetary policy tightening and higher interest rates, manufacturing tends to slow because manufactured, durable goods like furniture, automobiles, airplanes and factory equipment become much more expensive to finance while loan qualification standards increase and employment conditions deteriorate. A continued contraction in manufacturing activity would point to the following changes: lower consumption/demand, lower inflation, lower long-term interest rates and lower GDP growth. If manufacturing activity ramps up again due to monetary policy easing, demand will rise, inflation will rise, short-term interest rates will fall and GDP growth will rise. The next month’s release will be on October 24th. It is currently expected to be 49, a decrease from the previous month’s reading of 49.8, remaining in contraction territory. Should the actual number be much lower or higher, we would have to adjust our outlook by slightly raising or lowering our estimate for economic indicators and ultimately our estimate for GDP.
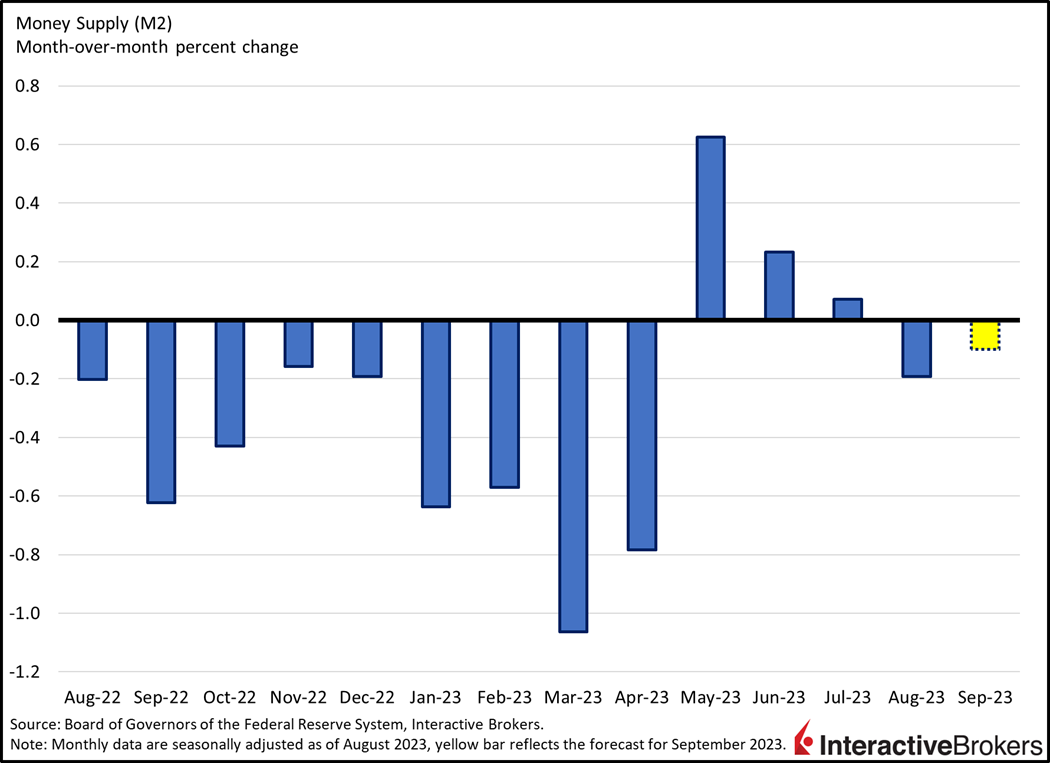
Money Supply
The rate of inflation is slowing against the backdrop of a contracting money supply. The money supply, inflation and economic growth shift a great deal due to the Fed’s monetary policy. After increasing drastically since the emergence of COVID-19 to help businesses and households cope with pandemic disruptions, the money supply has contracted from its April 2022 peak. The Fed has pivoted from an accommodative monetary policy stance towards a restrictive one because it recognizes that money supply growth during years 2020 and 2021 contributed to today’s high inflation. The more persistent inflation ends up being, the longer the Fed will have to maintain a restrictive position and therefore, limit money supply growth. At this point in time, the aggregate money supply is contracting because the Fed has more work to do in order to achieve the 2% inflation target. The Fed has embarked on an aggressive rate hiking campaign and has increased the pace of balance sheet reduction to a monthly cap of $95 billion from $47.5 billion in the months prior. A continued contraction in the money supply would point to the following changes: lower consumption/demand, lower inflation, lower long-term interest rates and lower GDP growth. If money supply growth ramps up again due to monetary policy easing, consumption will rise, demand will rise, inflation will rise, short-term interest rates will fall and GDP growth will rise. The next month’s release will be on October 27th. It is currently expected to decline 0.1% to $20.84 trillion from the previous period’s $20.86 trillion, a 0.2% decline from July. Should the actual number be much lower or higher, we would have to adjust our outlook by slightly raising or lowering our estimate for economic indicators and ultimately our estimate for GDP.
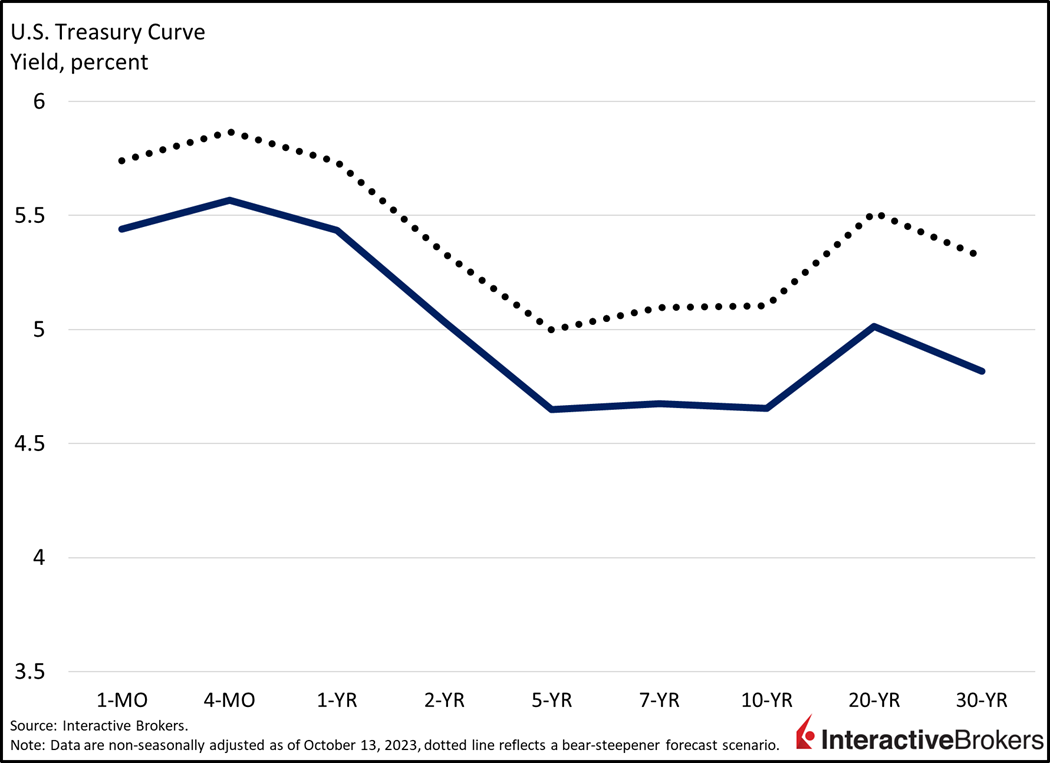
Yield Curve
The yield curve is deeply inverted against the backdrop of tighter financial conditions and weak economic prospects. As the 2-year yield rose much faster than the 10-year since January 2022, a bear-flattening move from a much steeper level from the previous two years, the yield curve remains in deep inversion territory (-38 bps), signaling economic contraction ahead. The money supply increase led to a rise in inflation which compelled the Fed to raise short-term rates significantly. The longer end of the curve, namely the 10-year maturity, didn’t rise as fast because longer term economic growth and/or inflation wasn’t expected to rise as strongly as short-term rates did. The yield curve inversion is telling us that there’s little chance the U.S. economy can handle the monetary policy tightening that’s in the pipeline without a recession. In this case a bull-flattener, where the 2-year would fall slower than the 10-year would be desirable but that would require inflation expectations to significantly come down further, which is unlikely to occur. Although inflation expectation figures are off their peaks, we believe inflation will prove stickier and more resilient than the market thinks. Against the backdrop of persistent core inflation and a tight labor market, the expectation in the coming months is to see a bear-steepener where the 10-year narrows its spread against the 2-year due to an increase in inflation expectations. The main drivers of structurally higher inflation in the medium to long-term are the shift from globalization towards regionalization, geopolitical tensions, relative inefficiencies regarding supply chains and the commodity complex, continued deficit spending and labor shortages. If the yield curve remains severely inverted, it points to lower consumption, lower demand, lower inflation, lower long-term interest rates and lower GDP growth. If the yield curve steepens again due to monetary policy easing, demand will rise, inflation will rise, short-term interest rates will fall and GDP growth will rise. The yield curve inversion (2s, 10s) has predicted the last 6 out of 6 recessions.
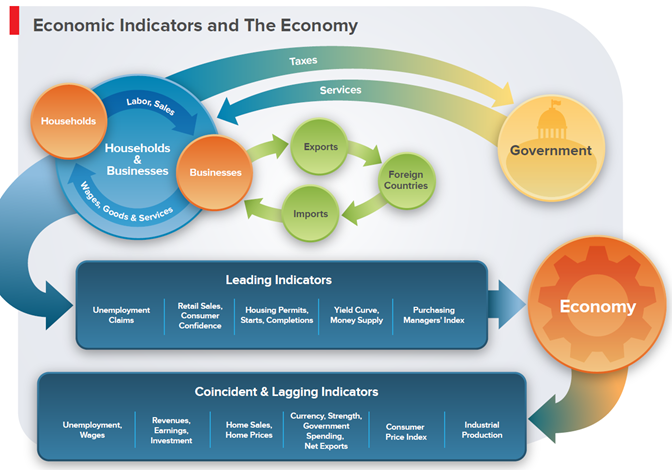
Economic Indicators & The Economy
Below is a picture showing how leading, coincident and lagging economic indicators reflect household, business and government activity. Leading indicators provide early signals of future economic health while coincident and lagging indicators confirm the economic trend in later periods.
Watch Videos About Key Economic Indicators at Traders’ Academy – Click Here
Disclosure: Interactive Brokers
Information posted on IBKR Campus that is provided by third-parties does NOT constitute a recommendation that you should contract for the services of that third party. Third-party participants who contribute to IBKR Campus are independent of Interactive Brokers and Interactive Brokers does not make any representations or warranties concerning the services offered, their past or future performance, or the accuracy of the information provided by the third party. Past performance is no guarantee of future results.
This material is from IBKR Macroeconomics and is being posted with its permission. The views expressed in this material are solely those of the author and/or IBKR Macroeconomics and Interactive Brokers is not endorsing or recommending any investment or trading discussed in the material. This material is not and should not be construed as an offer to buy or sell any security. It should not be construed as research or investment advice or a recommendation to buy, sell or hold any security or commodity. This material does not and is not intended to take into account the particular financial conditions, investment objectives or requirements of individual customers. Before acting on this material, you should consider whether it is suitable for your particular circumstances and, as necessary, seek professional advice.


Join The Conversation
If you have a general question, it may already be covered in our FAQs. If you have an account-specific question or concern, please reach out to Client Services.