


All examples in this report are hypothetical interpretations of situations and are used for explanation purposes only. The views in this report reflect solely those of the author and not necessarily those of CME Group or its affiliated institutions. This report and the information herein should not be considered investment advice or the results of actual market experience.
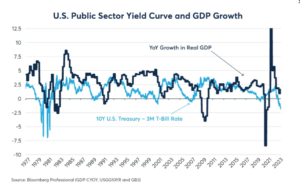
In what might have been the last rate hike of the current monetary policy tightening cycle, the Federal Reserve (Fed) raised interest rates to 5.125% on May 3. Through the cycle that began in March last year, the Fed has cumulatively raised rates by 500 basis points (bps), the largest since 1981. By early May, U.S. short-term interest rates were around 140 bps above long-term bond yields, making for the most extreme yield curve inversion since 1981 (Figure 1).
Figure 1: The U.S. has the steepest yield curve inversion since 1981

Yield curve inversions often precede economic downturns by one to two years (Figure 2). The size of the Fed tightening and the degree of the current yield curve inversion has left many wondering if the U.S. is heading toward a recession, and, if so, when it might begin? There are also expectations for the U.S. to avoid a recession, getting away instead with a “soft landing,” where the economy avoids a contraction but still slows down enough to allow inflation to subside, and for the Fed to ease policy.
History offers some guidance as to the probabilities of a downturn versus soft landing. Over the past 40 years, the Fed has taken the U.S. through six previous tightening cycles. Of those, four were followed by a recession, and two by soft landings (Figure 3). When recessions did happen, they began 10-17 months after the Fed’s last rate hike. The National Bureau of Economic Research (NBER) defines a recession as a “significant decline in economic activity.” This definition is more nuanced that the often cited but incorrect “two straight quarters of negative GDP growth.”
Figure 2: Shape of yield curve correlates positively with GDP growth 3-8 quarters in the future

Figure 3: Peaks in Fed rates were often followed by recessions 10-17 months later
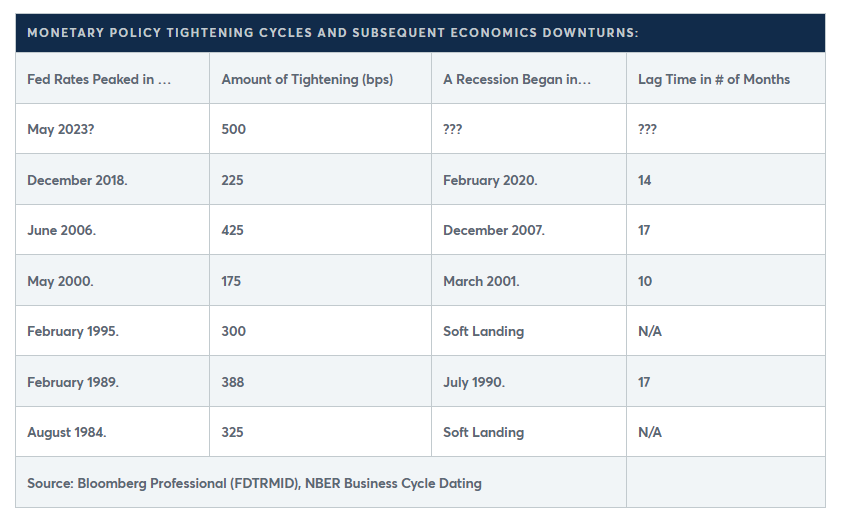
Among the recessions listed in the table above is the brief, but deep, downturn that began in February 2020. It was caused by the policy response to the COVID-19 pandemic, and we will never know if a normal cyclical downturn would have happened had the pandemic not occurred. Excluding the 2015-2018 tightening cycle from the analysis, Fed tightening cycles were followed by downturns only in three of the five cases. This suggests that the probability of a recession in the relatively near future might be as low as 60%.
However, there are several reasons to think that the risk of an economic downturn might be much higher. For starters, the Fed hiked rates by 500 bps in the past 14 months. This is far greater than in any previous tightening cycle since 1981. The 1981 tightening cycle, which was part of a broader period of tightening that began in 1979, resulted in the deepest recession since the Great Depression of the 1930s.
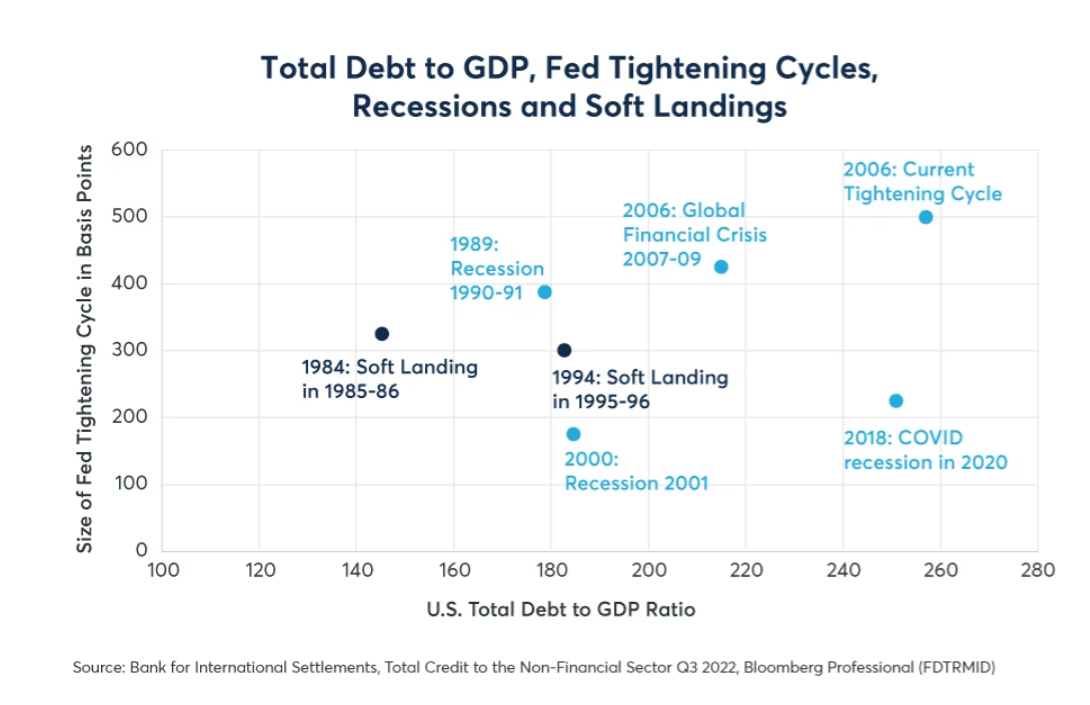
A second reason why the probability of a recession in the next two years might exceed 60% is the level of debt and leverage in the U.S. economy. Previous tightening cycles happened during periods of much lower levels of leverage. For example, the total debt-to-GDP ratio was around 130-135% at the time of the 1979 and 1981 tightening cycles. By the time of the 1984 tightening cycle, the ratio had risen to 150%. When the 1989 tightening cycle ended, it was 180%. By the May 2000 peak in Fed funds, it was 185%, and by the time the Fed stopped hiking rates in 2006, debt had risen to 217% of GDP. As of Q3 2022, the most recent quarter for which we have data, the total U.S. debt-to-GDP ratio was 257.5%. So not only does the size of the Fed’s current tightening cycle dwarf anything that it’s done in the past 40 years, the combination of public and private sector debt is also far larger than it was during past tightening cycles.
Figure 4: U.S. debt levels have risen steadily over the past few decades

For the moment, the U.S. economy still appears to have decent forward momentum. Household incomes are growing strongly. Although the job market is cooling, unemployment remains low, job growth is still positive, and there are still nearly 9.6 million open positions as of the end of March. Even so, there are warning signs. Three regional banks collapsed in the past two months. If the Fed’s 500-bps of tightening slows growth further, default rates could eventually rise and banks might curtail lending further, creating the potential for a downward spiral in economic activity.
Figure 5: The Fed may have had an easier time engineering soft landings when debt was lower.
—
Originally Posted May 25, 2023 – If There is an Economic Downturn, When Will It Begin?
All examples in this report are hypothetical interpretations of situations and are used for explanation purposes only. The views in this report reflect solely those of the author and not necessarily those of CME Group or its affiliated institutions. This report and the information herein should not be considered investment advice or the results of actual market experience.
Join The Conversation
If you have a general question, it may already be covered in our FAQs. If you have an account-specific question or concern, please reach out to Client Services.
Leave a Reply
Disclosure: Interactive Brokers
Information posted on IBKR Campus that is provided by third-parties does NOT constitute a recommendation that you should contract for the services of that third party. Third-party participants who contribute to IBKR Campus are independent of Interactive Brokers and Interactive Brokers does not make any representations or warranties concerning the services offered, their past or future performance, or the accuracy of the information provided by the third party. Past performance is no guarantee of future results.
This material is from CME Group and is being posted with its permission. The views expressed in this material are solely those of the author and/or CME Group and Interactive Brokers is not endorsing or recommending any investment or trading discussed in the material. This material is not and should not be construed as an offer to buy or sell any security. It should not be construed as research or investment advice or a recommendation to buy, sell or hold any security or commodity. This material does not and is not intended to take into account the particular financial conditions, investment objectives or requirements of individual customers. Before acting on this material, you should consider whether it is suitable for your particular circumstances and, as necessary, seek professional advice.


JOE BIDEN GETS BLAMED FOR THE INFLATION ? IF A LITTLE INFLATION IS WHAT MADE THE AMERICAN ECONOMY HUMM, LET DO MORE OF WHAT Joe has been doing