


Investor sentiment is uncertain following this morning’s stronger than expected CPI data as market participants wait to see if Fed Chair Powell’s comments and the revised Summary of Economic Projections (SEP) spread holiday cheer tomorrow or embolden the Grinch. An SEP that is consistent with investors’ expectations for five rate cuts in 2024 will likely drive equities to a Santa Claus rally, whereas projections for only two to three cuts could cause equities to join the Grinch in finishing the year on a dour note.
Inflation Comes in Hotter Than Projected
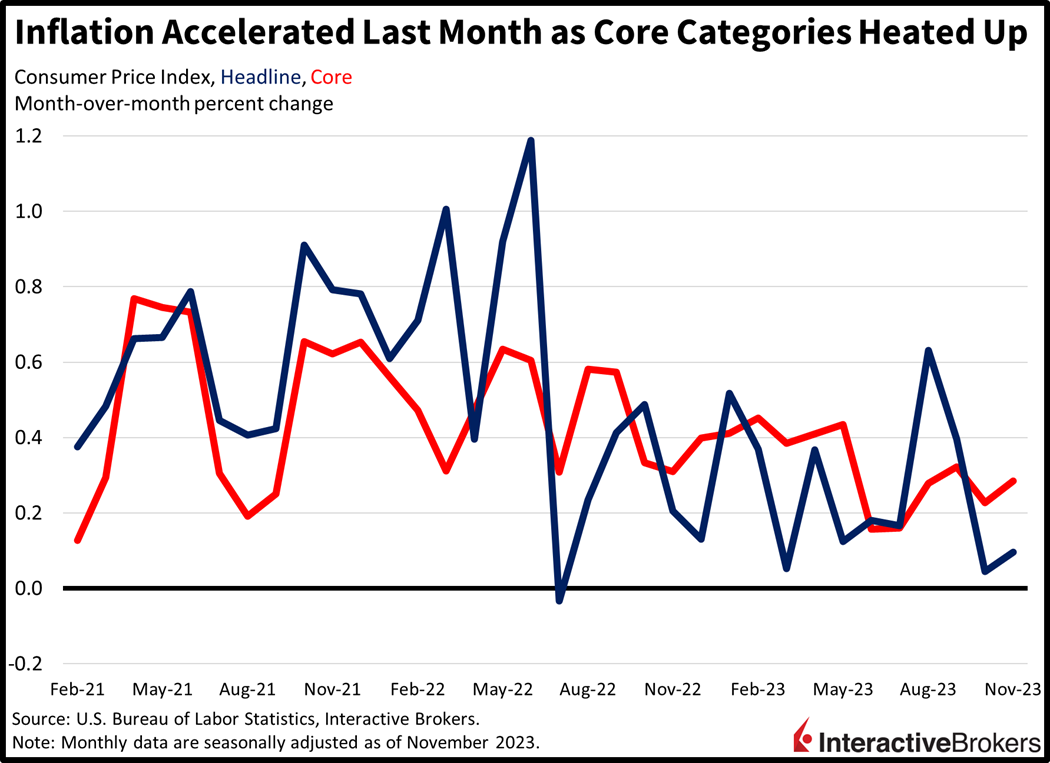
Consumer prices rose 0.1% month over month (m/m) in November, as the impacts of much lower gasoline prices offset broad increases in most other categories. Economists were expecting another doughnut (0% m/m), however, identical to October’s read. Core prices, which exclude food and energy and are more sensitive to services, didn’t receive the benefit of sharp cost relief at the pump and rose 0.3% m/m, in line with projections but accelerating from the previous month’s 0.2%. On a year-over-year basis, the headline figure rose 3.1% while core increased 4%, exactly as anticipated and near October’s figures of 3.2% and 4%.
Most Categories Increased but Gasoline Saved the Day
On a worrisome note, most segments experienced cost increases, but gasoline’s sharp price decline prevented much of an impact on the headline figure. Indeed, the following categories experienced the noted m/m price increases:
- Energy services (heating and electricity), 1.7%
- Used automobiles, 1.6%
- Transportation services, 1.1%
- Medical care services, 0.6%
- Medical care commodities, 0.5%
- Food at dining establishments, 0.4%
- Shelter, 0.4%
- Food at home 0.1%
Meanwhile, gasoline, apparel and new automobiles capped the increase to the headline figure with m/m price declines of 6%, 1.3% and 0.1%.
Volatility Reaches Four Year Low
Markets are patiently waiting for tomorrow’s Fed meeting, with stock indices and bond yields mixed. Following a sharp year-to-date rally amidst loosening financial conditions, a disconnect between the number of 2024 rate cuts in the Fed’s SEP versus what market players are pricing in could certainly spark volatility. Additionally, investors are relatively sanguine with the Volatility Index (VIX) having just reached its lowest level since January 2020. Furthermore, I spoke with our Chief Strategist Steve Sosnick this morning and he noted that a dot plot (SEP) that falls well short of current projections could certainly spook markets, and unless Powell is willing to disavow his colleagues’ projections, he will need to spend a fair amount of tomorrow’s press conference explaining why the FOMC’s views are so far off the markets’.
Markets Await Powell
Stock indices are mixed, with the Nasdaq Composite, Dow Jones Industrial and S&P 500 indices higher by 0.3%, 0.3% and 0.1% while the Russell 2000 Index is down 0.2%. Sectoral breadth is generally positive, with all sectors higher except for energy, utilities and consumer discretionary. They are down 1%, 0.8% and 0.2%. Meanwhile, financials and materials are leading, with the sectors higher by 0.5% and 0.4%. The energy sector’s sharp price decline is attributed to crude oil’s battering amidst oversupplied conditions. OPEC + is struggling to convince many of its members to commit to production cuts, especially those that are in need of hard currency. This occurs as Moscow’s seaborne crude exports have soared to their highest level since July. As the U.S. achieves record production and maintains robust inventory, a lack of relief from the demand side is weighing on the commodity’s price. Indeed, consumption in the U.S. is slowing and Beijing, the world’s largest importer of oil, is dealing with much worse economic problems, which together are contributing to less demand for barrels. WTI crude is down a whopping 3.5%, or $2.48, to $68.86 per barrel today. In fixed income and currency land, bond yields are mixed, with the short-end higher but the long-end lower, as the 2- and 10-year Treasury maturities trade at 4.71% and 4.212%, roughly 1 basis point (bps) higher and 2 bps lower, respectively. The dollar is lower, with the greenback losing value versus the yen, franc, euro, pound sterling and yuan while it gains versus the Aussie and Canadian dollars. The U.S. currency’s index is down 20 bps to 103.88.
Anticipation Builds for Tomorrow’s Fed Meeting
Slowing demand trends reflect the pivotal nature of consumers’ finances softening this quarter. October marked an important inflection point as the exhaustion of excess pandemic savings coincided with the resumption of student loan repayments. This reduction of consumer spending capacity has stark representation in economic data with the Federal Reserve Bank of Atlanta’s GDPNow reflecting a 1.2% growth rate for the current quarter, compared to last quarter’s staggering 5.2% pace. As we cross the monetary policy bridge and anxiously await the Fed’s first rate cut, staying above 0% on GDP while maintaining cyclical, private sector job growth will be pivotal for keeping the expansion alive and achieving a soft landing. For now, the Fed faces the considerable challenge of maintaining its terminal fed funds rate long enough to ensure that it will dampen inflation in a sustainable manner while not tipping the economy into recession. To accomplish the mission, we need temperature neutral data during our journey across the bridge – not too hot, not too cold.
Visit Traders’ Academy to Learn More About the Consumer Price Index and Other Economic Indicators.
Join The Conversation
If you have a general question, it may already be covered in our FAQs. If you have an account-specific question or concern, please reach out to Client Services.
Leave a Reply
Disclosure: Interactive Brokers
Information posted on IBKR Campus that is provided by third-parties does NOT constitute a recommendation that you should contract for the services of that third party. Third-party participants who contribute to IBKR Campus are independent of Interactive Brokers and Interactive Brokers does not make any representations or warranties concerning the services offered, their past or future performance, or the accuracy of the information provided by the third party. Past performance is no guarantee of future results.
This material is from IBKR Macroeconomics and is being posted with its permission. The views expressed in this material are solely those of the author and/or IBKR Macroeconomics and Interactive Brokers is not endorsing or recommending any investment or trading discussed in the material. This material is not and should not be construed as an offer to buy or sell any security. It should not be construed as research or investment advice or a recommendation to buy, sell or hold any security or commodity. This material does not and is not intended to take into account the particular financial conditions, investment objectives or requirements of individual customers. Before acting on this material, you should consider whether it is suitable for your particular circumstances and, as necessary, seek professional advice.


I have figured out that the ideal rate to control inflation is 2% about the target. In this case, if inflation is 3%, then the Fed rate should be 5%. According to this, the Fed is done unless inflation ticks up. Once the trend starts moving down, then Fed will cut. For now, they need to hold until inflation decreases. At the end, the Fed should hold rates at 4% to maintain a 2% inflation rate.
If you factor in current shelter inflation then we are already close or under 2%.
I think the whole thing is a shell game. With 20 years of money printing asset prices (market real estate etc) have soaked up the money – which went to the top 1%.
Rates were at 5% for 20years before the bankers’ cartel got in the business of rigging rates (2009 forwards). If they had not manipulated rates then Fed rates would have stayed in the 5% range, which is correct for cost of capital in a free market.
The govt CPI is rigged – computationally – since the 70’s and this has allowed the Govt to steal from pensioners receiving old age security, pensioners with COLA, those who should be in fixed income and bond investments – pension plans, and from workers.
They are overpaid crooks who care nothing about the economy or people.
Private pension plans need returns of more than 5% to stay solvent and so with years of subpar rates most are insolvent.
“It’s one big club and you ain’t in it.” George Carlin