


Should you believe in the Santa Rally theory, which suggests that stocks rise in the last days of the year? What does data from the last 94 years tell us?
Investors found their festive spirits in 2020 despite a raging pandemic. Even with most of the global economy shut due to Covid-19, US stocks recorded their best December monthly return in over a decade, with the Ibbotson SBBI US Large Cap index returning 3.8%.
It was the second year in succession that US stocks have rallied over the holiday season, following the second worst December on record two years earlier.
In December 2018 US stocks returned -9% amid concerns over the health of the global economy – little did we know a catastrophic pandemic would arrive just over a year later.
December 2018 wasn’t very cheery for investors, but it was only the seventh time in the last 35 years that the “Santa Rally” failed to materialise.
In fact, December remains one of the most prosperous months for stocks.
What is the “Santa Rally”?
The “Santa Rally” is a supposed effect of the Christmas feel-good factor, helping US stocks record positive returns at the end of the year, although many seasoned investors remain unconvinced.
It’s unwise to draw firm conclusions from stock market history, indeed past performance is not a guide to future performance and may not be repeated. But in the spirit of festive fun, Schroders analyses the data each year.
What are the chances of a Santa Rally?
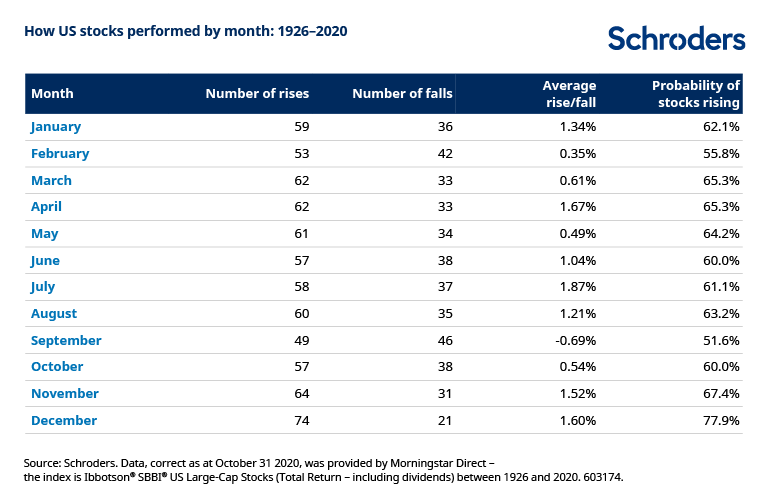
The data shows that US stocks have recorded a positive return in 77.9% of Decembers since 1926, with stock prices returning on average 1.6%, according to data stretching back to 1926 which was analysed by Schroders and provided by Morningstar Direct.
Out of the 12 months of the year, December has by far the highest probability of positive returns, perhaps adding some substance to the “Santa Rally” myth.
This material is not intended to provide advice of any kind. Information herein is believed to be reliable but Schroders does not warrant its completeness or accuracy. Past performance is not a guide to future returns and may not be repeated.
Why have stock markets performed better in December?
There is much speculation as to the reasons for the “December effect”. One theory is based around investor psychology. There is, perhaps, more goodwill cheer in the markets due to the holiday season putting investors in a positive mood, which drives more buying than selling.
Another view is that fund managers, which account for a substantial part of share ownership, are re-balancing portfolios ahead of the year-end. By selling some better performing stocks managers can afford to buy more of the underperforming ones, pushing up prices.
The danger of superstitions
The dramatic stock market fall in December 2018 proves two things: past performance cannot be relied upon and stock market superstitions are only true until they fail to be.
Stock market history can be fascinating, but it can often lead to assumptions – that Octobers are bad or that you should sell in September.
In fact, trying to time markets at all is a questionable strategy as it is impossible to predict short-term movements in the market.
Facts and figures from other months
While history suggests December is the month in which stocks are most likely to post a positive return, June is the month in which historic returns have been highest.
In June stocks have returned on average 1.87% since 1926.
September was the worst month for US investors, with stocks managing a positive return just 51.6% of time and returning -0.69% over the last 95 years.
Why do stocks perform so poorly in September?
The “September effect” refers to historically weak stock market returns for the month of September. Investors returning from their holidays are believed to lock in tax gains and losses before the year end, and also sell stock to help fund their children’s education.
But as with many calendar effects, the September effect is considered a historical quirk in the data.
Take October or “shocktober”, for instance. October has provided positive returns 60% of the time, with stocks returning an average of 0.59%. Yet throughout stock market history, October has seen some calamitous days.
October 1987: Black Monday
On 19 October 1987 global stock markets crashed amid worries about a slowing global economy and high stock valuations. The concerns were compounded by a computer glitch. Global stocks fell on average by 23% in October that year.
October 1997: Asian financial crisis
The Asian financial crisis began in the summer of 1997. A sequence of currency devaluations in Asia rocked global confidence. Global stocks fell by 6.6% in October that year.
October 2008: Global financial crisis
The seeds of the global financial crisis were sown when the US housing market began to collapse in 2007. The full extent wasn’t realised until Lehman Brothers investment bank collapsed in September 2008. The global financial system seized up and a month later global stocks had fallen by more than 15%.
October 2018: Trade wars and rising rates
Investors fretted about issues such as US-China trade tensions, European political uncertainty and the withdrawal of quantitative easing stimulus programmes. Global stocks fell 7.4% that October. It was the worst monthly performance for stocks globally in six years and it was the tenth worst in the last decade.
Time in the market
Separately, Schroders’ calculations also showed that if in March 2003 you had invested $1,000 in the MSCI World and left the investment alone for the next 15 years, it would have been worth $4,211. Figures have not been adjusted for inflation or fees.
However, if you had tried to time your entry in and out of the market during that period and missed out on the index’s 30 best days, the same investment would now be worth $1,268, or $2,943 less.
Investors’ best bet is to be patient and give their investment time to grow. The general rule is five years to allow for stock markets to go through their natural cycles.
As with all investing, the value of investments and the income from them may go down as well as up and investors may not get back the amounts originally invested.
—
Originally Posted on November 23, 2021 – Is The “Santa Rally” Real?
The views and opinions contained herein are those of Schroders’ investment teams and/or Economics Group, and do not necessarily represent Schroder Investment Management North America Inc.’s house views. These views are subject to change. This information is intended to be for information purposes only and it is not intended as promotional material in any respect.
Disclosure: Schroders
Important Information: This communication is marketing material. The views and opinions contained herein are those of the author(s) on this page, and may not necessarily represent views expressed or reflected in other Schroders communications, strategies or funds. This material is intended to be for information purposes only and is not intended as promotional material in any respect. The material is not intended as an offer or solicitation for the purchase or sale of any financial instrument. It is not intended to provide and should not be relied on for accounting, legal or tax advice, or investment recommendations. Reliance should not be placed on the views and information in this document when taking individual investment and/or strategic decisions. Past performance is not a reliable indicator of future results. The value of an investment can go down as well as up and is not guaranteed. All investments involve risks including the risk of possible loss of principal. Information herein is believed to be reliable but Schroders does not warrant its completeness or accuracy. Some information quoted was obtained from external sources we consider to be reliable. No responsibility can be accepted for errors of fact obtained from third parties, and this data may change with market conditions. This does not exclude any duty or liability that Schroders has to its customers under any regulatory system. Regions/ sectors shown for illustrative purposes only and should not be viewed as a recommendation to buy/sell. The opinions in this material include some forecasted views. We believe we are basing our expectations and beliefs on reasonable assumptions within the bounds of what we currently know. However, there is no guarantee than any forecasts or opinions will be realized. These views and opinions may change. Schroder Investment Management North America Inc. is a SEC registered adviser and indirect wholly owned subsidiary of Schroders plc providing asset management products and services to clients in the US and Canada. Interactive Brokers and Schroders are not affiliated entities. Further information about Schroders can be found at www.schroders.com/us. Schroder Investment Management North America Inc. 7 Bryant Park, New York, NY, 10018-3706, (212) 641-3800.
Disclosure: Interactive Brokers
Information posted on IBKR Campus that is provided by third-parties does NOT constitute a recommendation that you should contract for the services of that third party. Third-party participants who contribute to IBKR Campus are independent of Interactive Brokers and Interactive Brokers does not make any representations or warranties concerning the services offered, their past or future performance, or the accuracy of the information provided by the third party. Past performance is no guarantee of future results.
This material is from Schroders and is being posted with its permission. The views expressed in this material are solely those of the author and/or Schroders and Interactive Brokers is not endorsing or recommending any investment or trading discussed in the material. This material is not and should not be construed as an offer to buy or sell any security. It should not be construed as research or investment advice or a recommendation to buy, sell or hold any security or commodity. This material does not and is not intended to take into account the particular financial conditions, investment objectives or requirements of individual customers. Before acting on this material, you should consider whether it is suitable for your particular circumstances and, as necessary, seek professional advice.


")
