


A few days can make all the difference. Things seemed bleak earlier this week, with some losing days that seemingly had us poised to test the prior week’s short-term lows. The key moment occurred on Wednesday morning, when indices turned around abruptly after failing to break down. The chart below shows the enormous turnaround, with a vertical line highlighting the key moment:
S&P 500 Index (SPX), 6 Day Chart, 5 Minute Bars
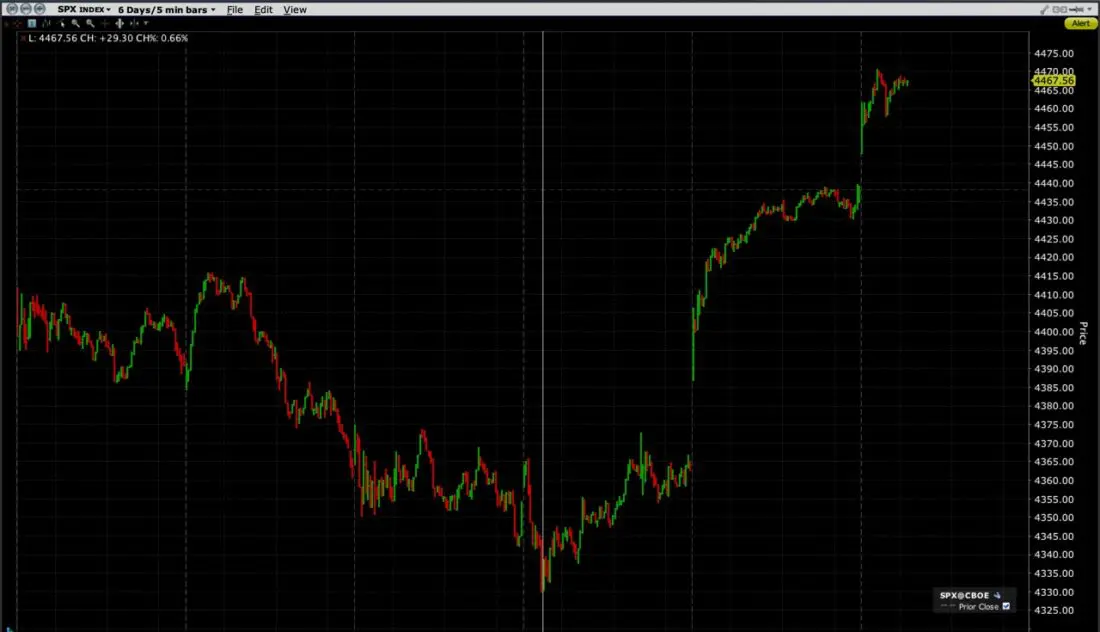
Source: Interactive Brokers
At the time, the turnaround seemed like part of a relatively normal trading pattern. But it is important to bear in mind that this is expiration week, when moves in markets can cause an outsized need for hedging and outsized moves in products with high open interest. (We explained this effect in this article). In yesterday’s piece, we noted that stocks were poised to rally after better-than-expected PPI and jobless claims were released, but that significant open interest in the expiring SPX 4410 calls acted as a slingshot once that level was approached.
We also theorized that opening today at or near the 4450 level was highly likely, barring any unforeseen exogenous events, because of the substantial open interest in options that expired at that level on the open. It was to be expected that anyone who was short 4450 strike options would have been incentivized to hedge, thus putting upward pressure on the index as it approached the strike in the pre-market. We exceeded the 4450 strike handsomely this morning, with the CME official settlement pegged at 4464.33.[i] It is not clear which direction the trading will take as the afternoon persists, not least because there is no nearby expiring strike in SPY or QQQ with outsized open interest.
Interestingly, as dramatic as the recent rise in major indices was, the plunge in the Cboe Volatility Index (VIX) was even more spectacular. Consider the following chart, which shows VIX dropping about 25% in just three days:
VIX 1 Week Chart, 3 Minute Bars

Source: Interactive Brokers
We spent most of Tuesday and some of Wednesday with VIX above 20. By Friday morning we were under 16. It was as though 2 days of gains led to an outbreak of complacency. It is not unusual to see VIX fall when SPX rises sharply, but the current dip brings us down nearly to levels seen during the summer’s rising markets:
VIX 6 Month Chart, Daily Bars

Source: Interactive Brokers
At this point we need to ask ourselves whether the VIX index is appropriate to the risk environment in markets overall. Remember that VIX is designed “to provide an instantaneous measure of how much the market thinks the S&P 500 Index will fluctuate in the 30 days from the time of each tick of the VIX Index.” We simply can’t compare the current fiscal and monetary climate to the one that prevailed at the last time VIX traded below 16.
Just this week, the most recent FOMC minutes confirmed that the Fed is likely to be tapering its bond purchases as soon as early next month, while Congress continues to dither about spending bills after only temporarily defusing the debt ceiling worries for less than 2 months. We elucidated these themes last week, as we pondered whether the changing monetary environment warranted a change in the tactics employed by traders. And by the way, we’re only 3 days into several weeks of key corporate earnings releases, where a key theme involved major bank CEOs asserting that inflation did not appear to be transitory to them. While it may be entirely appropriate for traders to be less fearful after a couple of days of rallies, there is a difference between less fearful and complacent. Seeing VIX drop from the low 20’s to the high teens is the former; watching it fall to the mid-teens is the latter.
—
[i] It is important to remember that opening index settlements are not the opening prices shown on a quote line. They are based on the opening prices of each individual index component, not the first reading of the index after markets open. The CME website explains more.
Disclosure: Interactive Brokers
The analysis in this material is provided for information only and is not and should not be construed as an offer to sell or the solicitation of an offer to buy any security. To the extent that this material discusses general market activity, industry or sector trends or other broad-based economic or political conditions, it should not be construed as research or investment advice. To the extent that it includes references to specific securities, commodities, currencies, or other instruments, those references do not constitute a recommendation by IBKR to buy, sell or hold such investments. This material does not and is not intended to take into account the particular financial conditions, investment objectives or requirements of individual customers. Before acting on this material, you should consider whether it is suitable for your particular circumstances and, as necessary, seek professional advice.
The views and opinions expressed herein are those of the author and do not necessarily reflect the views of Interactive Brokers, its affiliates, or its employees.
Disclosure: Margin Trading
Trading on margin is only for experienced investors with high risk tolerance. You may lose more than your initial investment. For additional information regarding margin loan rates, see ibkr.com/interest
Disclosure: Options Trading
Options involve risk and are not suitable for all investors. Multiple leg strategies, including spreads, will incur multiple commission charges. For more information read the "Characteristics and Risks of Standardized Options" also known as the options disclosure document (ODD) or visit ibkr.com/occ
Disclosure: Futures Trading
Futures are not suitable for all investors. The amount you may lose may be greater than your initial investment. Before trading futures, please read the CFTC Risk Disclosure. A copy and additional information are available at ibkr.com.


