


Yesterday, we discussed why the 30-ish level of the Cboe Volatility Index (VIX) is more about reasonable expectations about volatility over the coming days than a sign of capitulation. With a steady stream of trading days that feature intraday moves of 2% or more, or 32% on an annualized basis, it is quite reasonable to see VIX at current levels.
There are two facets about VIX that are worth analyzing in greater depth. First, is that VIX futures can be a very poor predictor of future volatility. Even though VIX and the underlying options on the S&P 500 Index (SPX) that are used in VIX’ calculations are actively traded, we can find numerous examples of the futures over- and undershooting the actual levels of VIX that eventually transpired. The graph below shows one such example:
VIX Futures Term Structure, Today (yellow), 1 Week Ago (red), 1 Month Ago (purple)
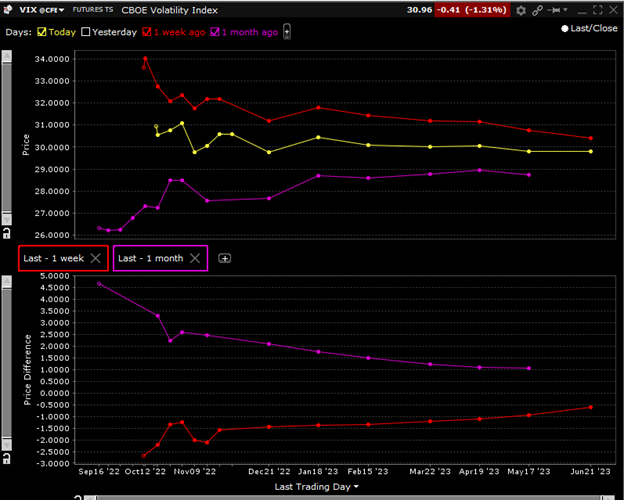
Source: Interactive Brokers
Last month, VIX futures were implying that the current level of VIX would be below 28 – over a three-point miss. That is an improvement over those same futures’ prediction for last week’s VIX, which missed by about 7 points. I realize that this is only one example – I can come up with many more – but I hope you get the point.
You might also recognize that here is a certain stickiness to future projections. This is human nature at work. We tend to project current results into the future. We’re now currently extrapolating 2% moves into the coming weeks. With earnings season and mid-term elections all coming within the next three weeks, it doesn’t seem unreasonable to think that volatility can continue. But as we have heard ad infinitum, past performance is not a guarantee of future success.
One other feature of this week’s trading is the upcoming monthly expiration on Friday. Although the popularity of weekly (and shorter) expirations has dampened some of the importance of monthly expirations, they still loom large because open interest can build up in those expiries over long periods of time. The chart below shows that implied volatility for this week’s expiration is at bit of a spike – though not nearly as spiky as we saw a week ago:
SPX Implied Volatility Term Structure, Today (yellow), 1 Week Ago (red), 1 Month Ago (purple)
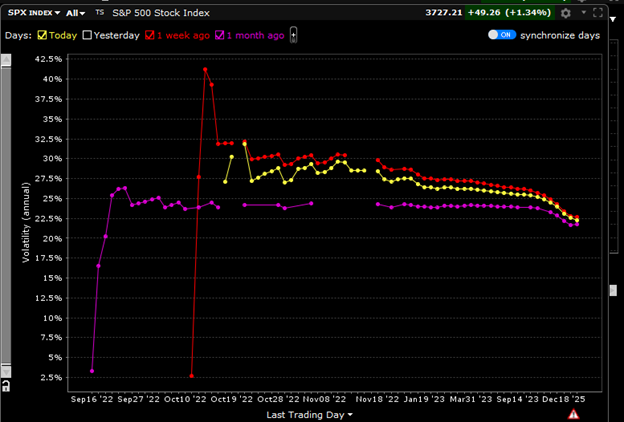
Source: Interactive Brokers
It is quite interesting to see that the implied volatility assumption for this Friday is currently almost the same as what it was a week ago. On that front, traders got it just right. We also see that traders continue to forecast average daily moves of just under 2% until December. This assumption is clearly higher than it was a month ago, but certainly within the ballpark.
Might the current volatility assessments be too high? Sure. If we really have found a meaningful bottom and neither earnings results nor political events prove worrisome. But until or unless we see the Fed and other central banks move away from their efforts to raise rates and withdraw liquidity, it is hard to see volatility fall to dramatically lower levels.
Disclosure: Interactive Brokers
The analysis in this material is provided for information only and is not and should not be construed as an offer to sell or the solicitation of an offer to buy any security. To the extent that this material discusses general market activity, industry or sector trends or other broad-based economic or political conditions, it should not be construed as research or investment advice. To the extent that it includes references to specific securities, commodities, currencies, or other instruments, those references do not constitute a recommendation by IBKR to buy, sell or hold such investments. This material does not and is not intended to take into account the particular financial conditions, investment objectives or requirements of individual customers. Before acting on this material, you should consider whether it is suitable for your particular circumstances and, as necessary, seek professional advice.
The views and opinions expressed herein are those of the author and do not necessarily reflect the views of Interactive Brokers, its affiliates, or its employees.
Disclosure: Options Trading
Options involve risk and are not suitable for all investors. Multiple leg strategies, including spreads, will incur multiple commission charges. For more information read the "Characteristics and Risks of Standardized Options" also known as the options disclosure document (ODD) or visit ibkr.com/occ


