


I’ve heard some infuriating takes about how the high level of VIX and inverted curve in its futures indicate a sign of potential capitulation. When we consider that “the VIX Index measures the 30-day expected volatility of the S&P 500 Index”, and then take into account that the coming 30 days include earnings season and a midterm election, it is sensible that VIX would see elevated values in the short-term.
While past is not always prologue, we are evidently in a period of high volatility. Let’s recap the past three days in the S&P 500 Index (SPX), shall we. Up 2.6% after recovering from a similar-sized intraday drop, down 2.4%, then up by 2.2% (as I write this). Nothing to see here, correct? Especially when two of the three sessions were big up days, aka “socially acceptable volatility”, right. In the sessions prior to today in the month of October, we’ve seen 6 of 10 close with moves over 2%. And let’s not forget the abundance of moves of 1.5% or more since September 1st, as shown in the graph below:
SPX, Daily Bars Since September 1st
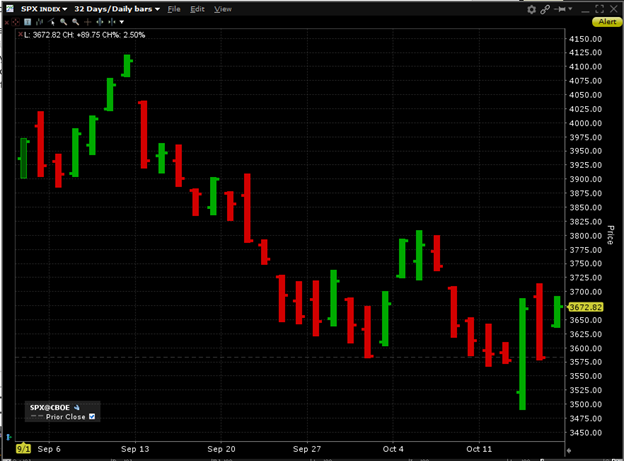
Source: Interactive Brokers
If we bear in mind that VIX and other common measures of volatility are displayed in annualized terms, we can use the “rule of 16” to convert them into daily terms. A volatility of 32 implies a set of daily moves of 2%. While the VIX methodology incorporates all call and put options with non-zero bids and times to expiration between 23 and 37 days, making it directly comparable with at-money SPX options, it is broadly consistent with at-money volatility assumptions and highly consistent over time.
The VIX futures curve also allows us to see whether expectations for future volatility are rising or falling. A glance at the current term structure show that traders have ratcheted up their volatility assumptions over the past month, though reduced them somewhat over the last week:
VIX Futures Term Structure, Today (October 17th, yellow), 1 Week Ago (red), and 1 Month Ago (purple), with 1-week (red) and 1-month (purple) Changes in Lower Panel
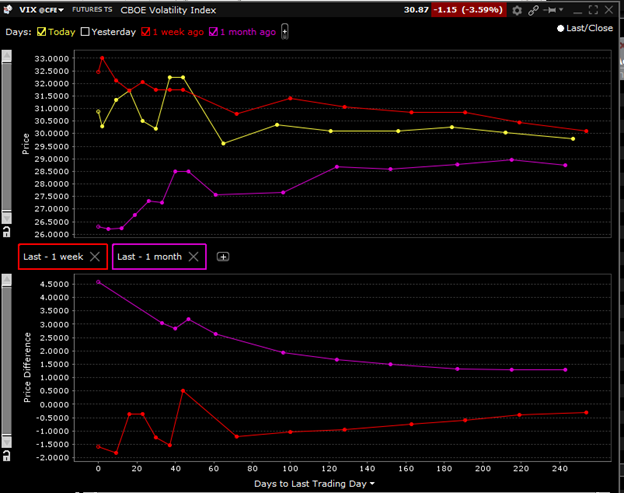
Source: Interactive Brokers
Some of the reduction in expectations since last week can be explained by the fact that we are no longer looking ahead to CPI and PPI numbers – they’re now behind us, with accompanying volatility. But it is reasonable to expect that some residual volatility can ensue over the coming weeks, and for volatility to decline once the midterm election is firmly in the rearview mirror. It is the latter event that should keep volatility expectations elevated in the near-term relative to the subsequent weeks and months. Just less than a month ago we asserted that the then-current 29 level of VIX seemed about right. I’ll make a similar assertion now, though it is highly subject to monetary and fiscal policy events, corporate earnings and the Congressional election. Come to think of it, that’s quite a litany of potential events. But as long as we remember what VIX is measuring – and it’s not fear – we can keep the current readings in the proper perspective.
Disclosure: Interactive Brokers
The analysis in this material is provided for information only and is not and should not be construed as an offer to sell or the solicitation of an offer to buy any security. To the extent that this material discusses general market activity, industry or sector trends or other broad-based economic or political conditions, it should not be construed as research or investment advice. To the extent that it includes references to specific securities, commodities, currencies, or other instruments, those references do not constitute a recommendation by IBKR to buy, sell or hold such investments. This material does not and is not intended to take into account the particular financial conditions, investment objectives or requirements of individual customers. Before acting on this material, you should consider whether it is suitable for your particular circumstances and, as necessary, seek professional advice.
The views and opinions expressed herein are those of the author and do not necessarily reflect the views of Interactive Brokers, its affiliates, or its employees.
Disclosure: Options Trading
Options involve risk and are not suitable for all investors. Multiple leg strategies, including spreads, will incur multiple commission charges. For more information read the "Characteristics and Risks of Standardized Options" also known as the options disclosure document (ODD) or visit ibkr.com/occ


