


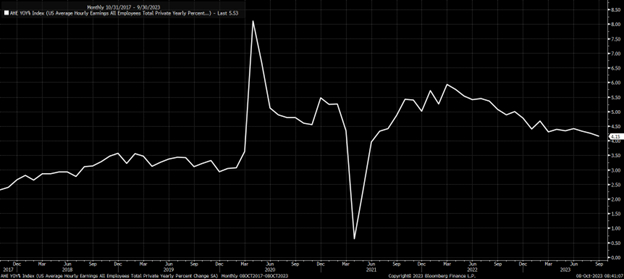
Mechanical aspects of the market took over on Friday after the surprise job report. The job growth was nearly double what was expected, while unemployment and wage growth were basically within the same range they had been for months. So, if there is progress in the labor market softening, it is tough to find, and the pace at which wage growth is coming down is way too slow to meet the Fed’s 2% inflation target anytime soon. The Fed needs wage growth closer to 3%, which is still over 4%. And while this job data alone isn’t likely enough to raise rates in November, it just pushes out the timeline for rates to stay higher.
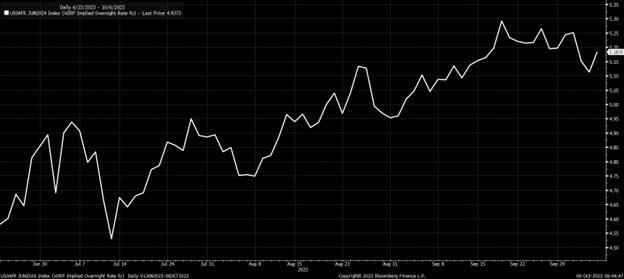
The changes in the path of monetary policy will not be found when looking for future rate hikes but will be found when the market is looking for rate cuts, and that changed on Friday. The call before the job report saw the first full rate cut coming in June, and that is now seen coming in July.
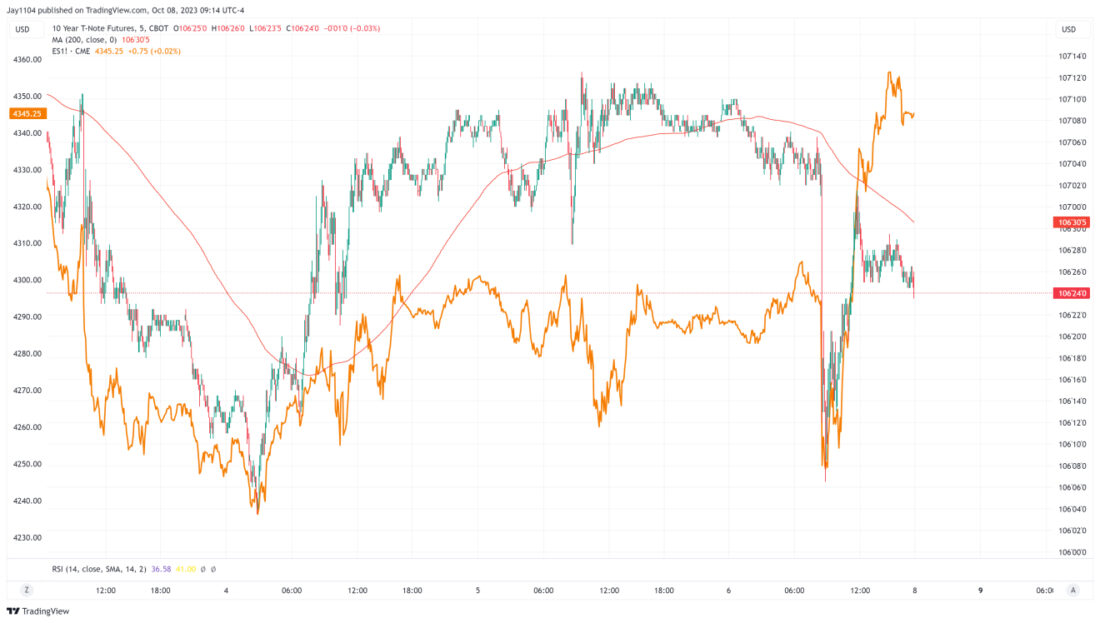
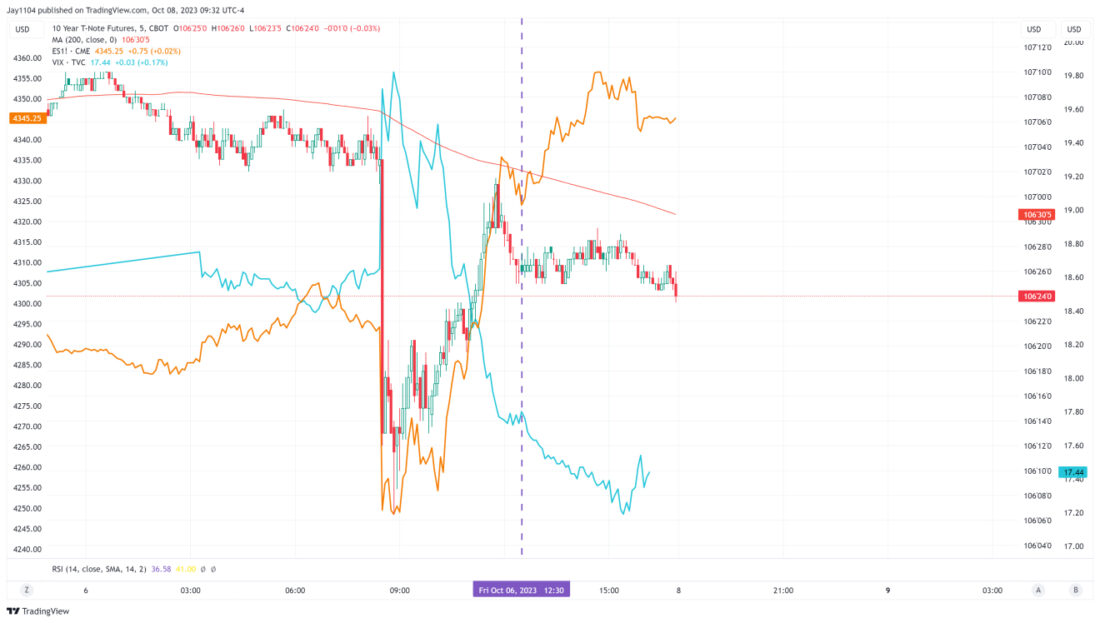
The results of the job report sent rates soaring and could have provided a preview of what is to come in the weeks ahead, with the ten and 30-year rates surging to almost 4.9% and 5.05%, respectively. It was the initial surge in rates that sent equity futures plunging, and it was the profit-taking in rates that followed that helped push stock prices higher, coupled with an implied volatility crush too.
10-Yr
The price of the 10-year futures contract after the data release traded sharply lower, and the S&P 500 futures traded down as 10-year rates surged. As treasury prices rebounded, probably as profit taking took place from those short futures, it helped to lift the equity market along with it because, if anything, it seems that the equity market is more positively correlated to the bond market over the past 2-years more than any recent time in memory.
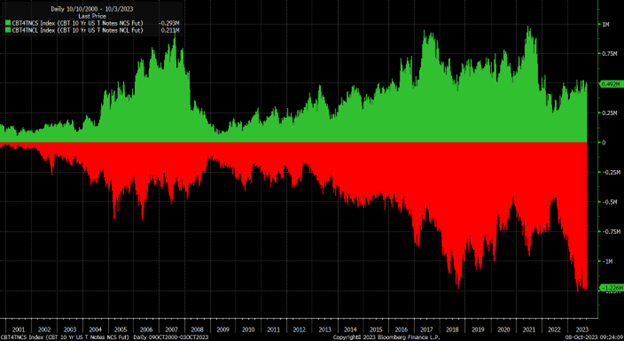
Short positioning in the 10-year is near record levels, and long positions in the 10-year are very low. So clearly, the market is heavily net short the 10-year and other bond contracts, and it seems possible that profit-taking in the morning drove rates off their highs and pushed bond prices up. But we can also see that as the day went on, the gap between stock and bond prices separated, and the separation was likely due to the implied volatility crush that we see after a typical event, as event risk ebbs.
The S&P 500 followed along with bond prices until 12:30 PM ET, when the VIX crush started, pushing stock prices higher. So the rally in the equity market had more to do with short-covering and profit-taking, volatility crushes, and mechanics than it had to do with some view that we are on a “golden path” to an “immaculate soft-landing.” Maybe we are on a path to a soft landing, but the more resilient the economy, the longer rates will stay higher, and the greater the risk that rates will go higher.
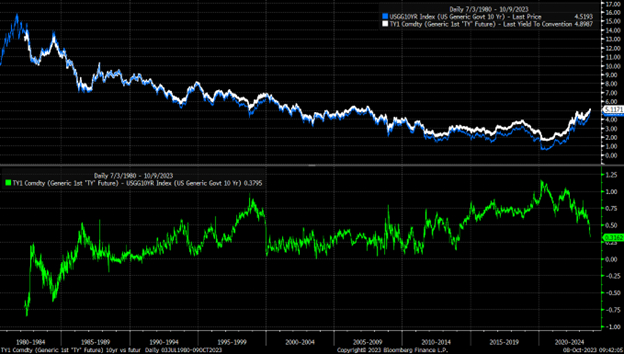
The risk here is that rates do go higher because the spread between the 10-year futures rate and the 10-year nominal rate is collapsing and appears to be heading back to levels in past decades, which is part of an arbitrage; it would seem what is probably part of a short-basis trade. It would make you think that as long as there is a spread to close, nominal rates on the 10-year probably move higher.
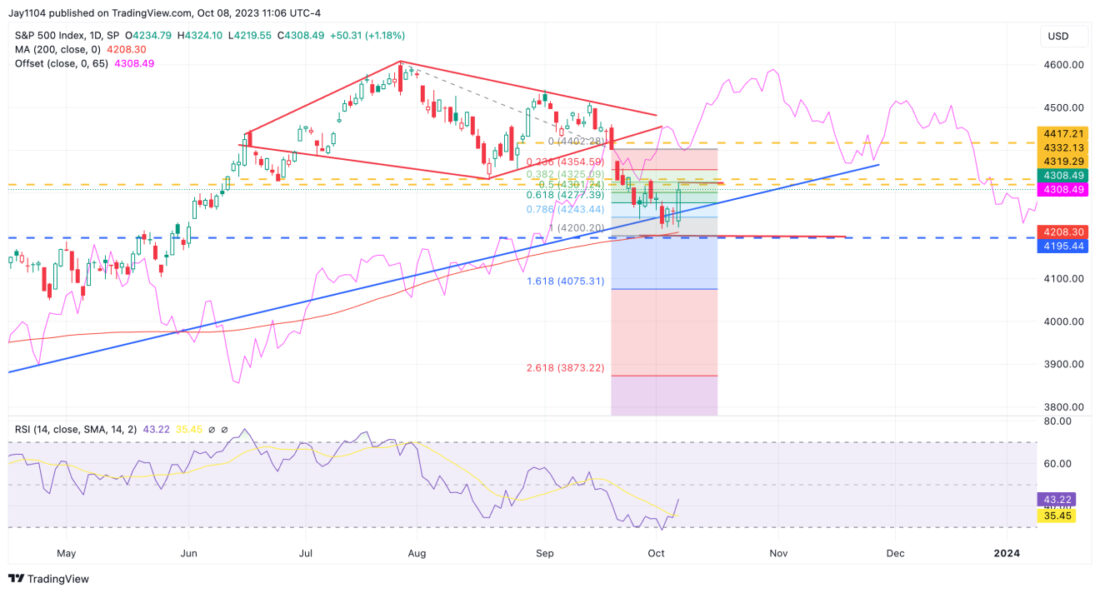
S&P 500 (SPX)
Meanwhile, the S&P 500 rallied to a resistance region of around 4,320 on Friday. It stopped, which was part of the August 2022 highs, which is essential because that area has acted as support and resistance. Unless the S&P 500 gaps over the 4,320 level on Monday, I think the 4,320 level holds, and the index trades lower and gives back much of the gains we saw on Friday, which probably means we get another retest of 4,200 at some point this week. If, for some reason, we do gap higher, there is still that gap at 4,400 that hangs out and is likely to be the next central resistance zone for the index.
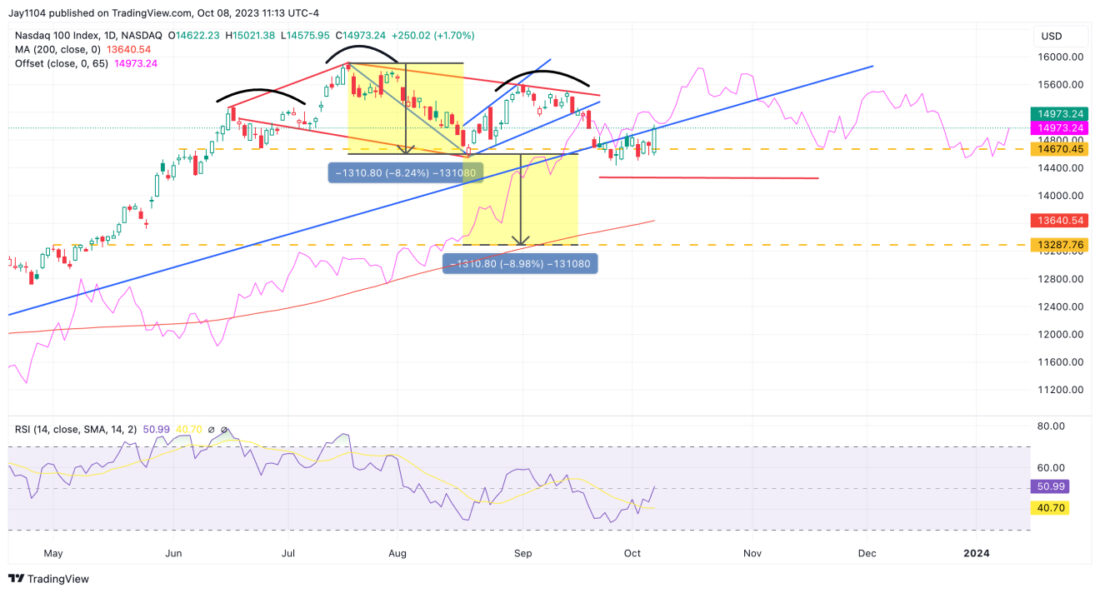
NASDAQ (NDX)
For the NASDAQ 100 it managed to rally, too, but it hit right up against resistance on Friday at the January uptrend and stopped. The NDX has occasionally tested that trendline and can’t get through it. Again, the NDX must gap over that trend line on Monday morning. Otherwise, we see the index back down and test the 14,270 area. It seems plausible if we do a gap higher than a rally to around 15,250.
More throughout the week.
—
Originally Posted October 8, 2023 – Mechanical Forces That Saved Stocks Following Jobs Report Is Not Likely To Last
Charts used with the permission of Bloomberg Finance L.P. This report contains independent commentary to be used for informational and educational purposes only. Michael Kramer is a member and investment adviser representative with Mott Capital Management. Mr. Kramer is not affiliated with this company and does not serve on the board of any related company that issued this stock. All opinions and analyses presented by Michael Kramer in this analysis or market report are solely Michael Kramer’s views. Readers should not treat any opinion, viewpoint, or prediction expressed by Michael Kramer as a specific solicitation or recommendation to buy or sell a particular security or follow a particular strategy. Michael Kramer’s analyses are based upon information and independent research that he considers reliable, but neither Michael Kramer nor Mott Capital Management guarantees its completeness or accuracy, and it should not be relied upon as such. Michael Kramer is not under any obligation to update or correct any information presented in his analyses. Mr. Kramer’s statements, guidance, and opinions are subject to change without notice. Past performance is not indicative of future results. Neither Michael Kramer nor Mott Capital Management guarantees any specific outcome or profit. You should be aware of the real risk of loss in following any strategy or investment commentary presented in this analysis. Strategies or investments discussed may fluctuate in price or value. Investments or strategies mentioned in this analysis may not be suitable for you. This material does not consider your particular investment objectives, financial situation, or needs and is not intended as a recommendation appropriate for you. You must make an independent decision regarding investments or strategies in this analysis. Upon request, the advisor will provide a list of all recommendations made during the past twelve months. Before acting on information in this analysis, you should consider whether it is suitable for your circumstances and strongly consider seeking advice from your own financial or investment adviser to determine the suitability of any investment.
Disclosure: Mott Capital Management
Mott Capital Management is the portfolio manager for one portfolio offered by Interactive Advisors. Interactive Advisors clients do not invest directly with the Portfolio Managers like Mott Capital Management, and the Managers do not have discretionary trading authority over Interactive Advisors client accounts. The Portfolio Managers on the Interactive Advisors platform simply license their trade data to Interactive Advisors, which then allows its clients to have the same strategy and trading decisions mirrored in their accounts if the Portfolio is in line with their risk score. Portfolio Managers like Mott Capital Management implement their trading philosophy and strategy without knowing the identity of Interactive Advisors’ clients or taking into account these clients’ individualized circumstances.
Mott Capital Management has entered into a Portfolio Manager License Agreement with Interactive Advisors pursuant to which it provides trading data IA uses to offer a portfolio to its investment advisory clients. Mott Capital Management is not affiliated with any entities in the Interactive Brokers Group.
Interactive Advisors is an affiliate of Interactive Brokers LLC.
Pursuant to the Investment Management Agreement between Interactive Advisors and its clients, all brokerage transactions occur through Interactive Brokers LLC, an affiliate of Interactive Advisors. The use of an affiliate for brokerage services represents a potential conflict of interest as Interactive Brokers LLC is paid a commission on trades executed on behalf of Interactive Advisors. Interactive Brokers LLC does not consider this conflict material as it does not sell, solicit, recommend, trade against or otherwise attempt to induce Interactive Advisors to place any orders in any products. Interactive Advisors does not offer services through any other broker-dealer. All trading by Interactive Advisors is self-directed. Interactive Advisors clients acknowledge this potential conflict of interest and authorize Interactive Advisors to execute transactions through Interactive Brokers LLC when they open an Interactive Advisors account. Clients should consider the commissions and other expenses, execution, clearance, and settlement capabilities of Interactive Brokers LLC as a factor in their decision to invest in an Interactive Advisors Portfolio. Interactive Advisors believes it satisfies its best execution obligation by trading its clients’ trades through Interactive Brokers LLC. While there can be no assurance that it will in fact achieve best execution, Interactive Advisors does periodically monitor the execution quality of transactions to ensure that clients receive the best overall trade execution pursuant to regulatory requirements.
Disclosure: Interactive Brokers
Information posted on IBKR Campus that is provided by third-parties does NOT constitute a recommendation that you should contract for the services of that third party. Third-party participants who contribute to IBKR Campus are independent of Interactive Brokers and Interactive Brokers does not make any representations or warranties concerning the services offered, their past or future performance, or the accuracy of the information provided by the third party. Past performance is no guarantee of future results.
This material is from Mott Capital Management and is being posted with its permission. The views expressed in this material are solely those of the author and/or Mott Capital Management and Interactive Brokers is not endorsing or recommending any investment or trading discussed in the material. This material is not and should not be construed as an offer to buy or sell any security. It should not be construed as research or investment advice or a recommendation to buy, sell or hold any security or commodity. This material does not and is not intended to take into account the particular financial conditions, investment objectives or requirements of individual customers. Before acting on this material, you should consider whether it is suitable for your particular circumstances and, as necessary, seek professional advice.


Join The Conversation
If you have a general question, it may already be covered in our FAQs. If you have an account-specific question or concern, please reach out to Client Services.