


What is the opposite of “if you’re in a hole, stop digging?” I can’t think of a clever adage, but if you can, please tell it to the Federal Open Market Committee (FOMC). The FOMC, which is responsible for the Federal Reserve’s activity in the marketplace, has been engaging in increasingly pointless activity. How else would you characterize their dual roles (not to be confused with the Fed’s dual mandate) of simultaneously adding and subtracting liquidity from the market on an ongoing basis?
For those who haven’t been paying attention for over a year, the Federal Reserve has been purchasing $120 billion in bonds each month. This quantitative easing (QE) has played an important role in boosting the economy and markets after last year’s Covid-related shock. When the Fed buys bonds, it pays cash for them. That cash is meant to find its way into the economy and ease financial conditions, though much of it undoubtedly finds its way directly into asset markets. The Fed certainly doesn’t mind robust markets, and investors love the effect of QE on asset prices.
While QE is a long-term method for providing liquidity into the economy, the Fed has other means to manage monetary flows on a daily basis. Repo and reverse repos are tools commonly utilized by the New York Fed to “support effective monetary policy implementation and smooth market functioning by helping maintain the federal funds (fed funds) rate within the FOMC’s target range.” Repos temporarily add liquidity to the financial system, while reverse repos temporarily drain liquidity.[i] If continued QE was truly necessary, why then do we see a graph that looks like this:
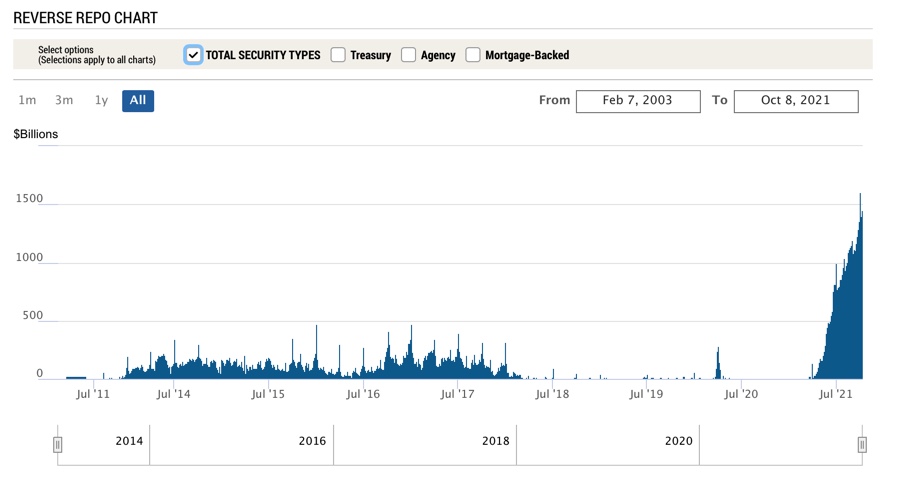
Source: https://www.newyorkfed.org/markets/desk-operations/reverse-repo
We have been seeing record or near-record levels of reverse repo activity on a sustained basis since this spring. Recent daily activity has been in the $1.3-$1.4 trillion range, with a peak of $1.6 trillion occurring at the end of last month.[ii] Let’s do a little bit of arithmetic here. This is almost a year’s worth of QE! ($120bn x 12 = $1.44 tn)
Yes, we have reached a point where nearly a year’s worth of QE shows up every day at the NY Fed. The central bank offers 0.05% on its overnight deposits. That means that banks and other counterparties who can access the Fed’s window can find nothing better to do each day with over $1 trillion in cash than seek a measly 5 basis points. It is reasonable to assume that short-term interest rates would turn negative if the Fed were not sopping up this excess liquidity.
This is why I believe that barring an exogenous catastrophe, the FOMC will announce that it will begin tapering its bond purchases at their next meeting on November 3rd. And no, a nonfarm payrolls report that shows 194,000 new jobs (plus a positive 2-month net revision of another 169,000) does not count as a catastrophe. On Friday we noted that the bond market seemed to agree, since rates rose even after the numbers missed economist estimates. And as we have been discussing for the past few weeks, investors have to be cognizant of the changes to the relentlessly accommodative monetary policy to which they have become accustomed.
The FOMC is a brainy group. I have no doubt that they recognize the futility of QE at this point. I believe that the only reason that they haven’t begun reducing QE already is that they are wary of disrupting markets and would rather continue simultaneously adding and withdrawing liquidity for an extra few weeks rather than risk upsetting investors. Of course, there is no guarantee that all investors actually will take tapering in stride. But forewarned is forearmed. By now, faithful readers should be formulating their game plans for the Fed’s impending retreat.
—
[i] The NY Fed’s full definitions of repo and reverse repo can be found here
[ii] Repo and/or reverse repo activity tends to peak around quarter ends; as banks manage their balance sheets they show in quarterly and year-end reports
Disclosure: Interactive Brokers
The analysis in this material is provided for information only and is not and should not be construed as an offer to sell or the solicitation of an offer to buy any security. To the extent that this material discusses general market activity, industry or sector trends or other broad-based economic or political conditions, it should not be construed as research or investment advice. To the extent that it includes references to specific securities, commodities, currencies, or other instruments, those references do not constitute a recommendation by IBKR to buy, sell or hold such investments. This material does not and is not intended to take into account the particular financial conditions, investment objectives or requirements of individual customers. Before acting on this material, you should consider whether it is suitable for your particular circumstances and, as necessary, seek professional advice.
The views and opinions expressed herein are those of the author and do not necessarily reflect the views of Interactive Brokers, its affiliates, or its employees.


