


Key takeaways
- Quality investing is not always exciting – but increased volatility and uncertainty in markets makes a compelling case for adding quality today.
- Quality has historically done best during economic slowdowns and contractions. Higher quality firms outperformed their lower quality peers in the largest drawdowns since the turn of the century.1
- While there’s a long-term strategic case to holding quality, today’s macro environment is a good reminder for investors to consider doing some “quality control” in their portfolios.
Fear of missing out, or “FOMO,” seems to be a common trend with investors. Whether it was GameStop, AMC, Bitcoin, or the FAANGs, the last few years has seen some investors exhibit FOMO as they chase the hottest trends in the market. In contrast, investing in the quality factor – investing in profitable companies with strong balance sheets – may seem… boring. But with increased volatility reflecting wavering investor conviction and changing expectations, it may be time for investors to do some “quality control” in their portfolios.
In the current banking crisis, several mid-sized regional banks felt the negative impact of idiosyncratic risk as the Fed raised rates by 475 basis points over a 12-month period.2 With the collapse of Silicon Valley Bank and Signature Bank in the US, and UBS’ acquisition of Credit Suisse in Europe, investor sentiment has shifted as expectations have been lowered and investors re-evaluate where to take risk in their portfolios.
The change in investor sentiment may be most apparent by looking at bond yields. The 2-year US Treasury yield saw its largest one-day decline since 1977 on March 13.
Largest single day moves in 2-year yields (since 1977)
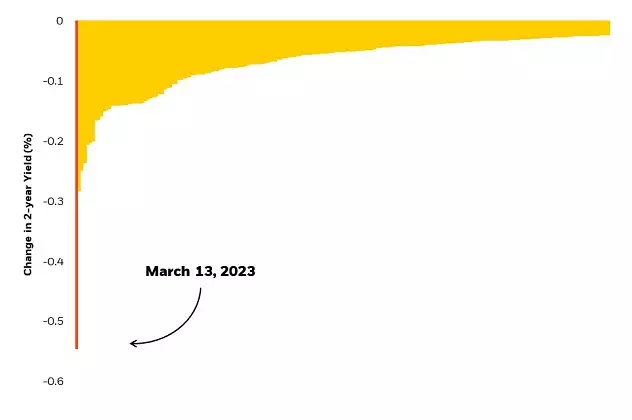
Source: Federal Reserve Board as of March 13, 2023. 2-year yield represents the yield received for investing in a 2-year US Treasury security. Yield calculates the return from a bond’s interest or coupon payments divided by price . Indexes are unmanaged and one cannot invest directly in an index. Past performance does not guarantee future results.
Whether or not we enter a recession, the recent developments in the banking industry, present an opportunity for investors to consider introducing higher-quality companies into their portfolio.
The opportunity for quality
Sometimes overlooked by its flashier factor cousins, momentum and value, quality investing is also supported by a wide body of academic research and empirical data.3 Historically, more profitable firms have outperformed their less profitable peers by 3.5% on average, over rolling 1-year periods.4
Quality companies are often better positioned to endure worsening economic conditions. In general, quality tends to perform best during economic slowdowns and contractions. When we look at the two largest drawdowns since the turn of the century, higher quality companies not only outperformed their lower quality peers, but also broad equity markets.5
Quality in crisis
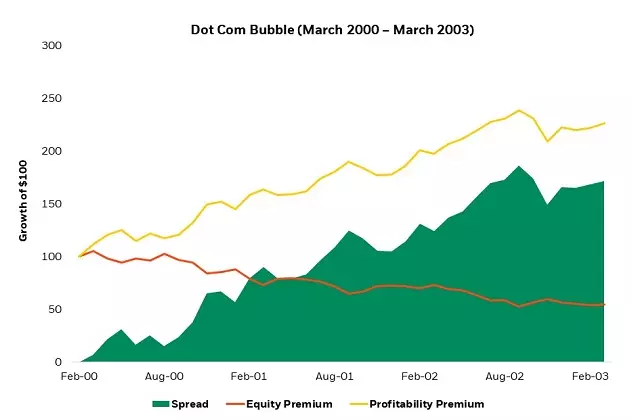
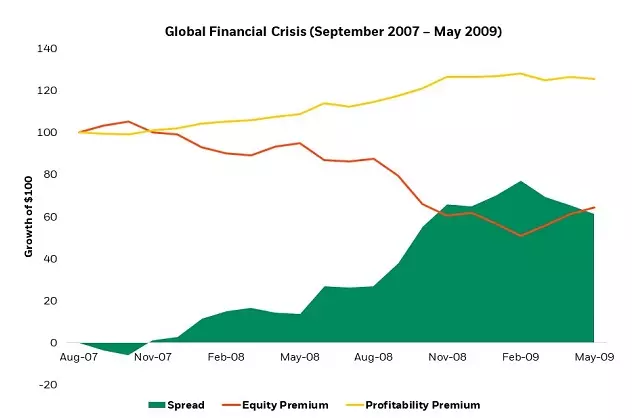
Source: Analysis by BlackRock using data from Ken French Data Library (https://mba.tuck.dartmouth.edu/pages/faculty/ken.french/data_library.html). Dot Com Bubble defined as March 2000 to March 2003. Global Financial Crisis defined as September 2007 to May 2009. Equity premium defined as Mkt-Rf which takes the difference between equities and the risk-free rate. Profitability premium defined as RMW (robust minus weak) which takes the difference between high profitability firms minus low profitability firms. Past performance does not guarantee future results.
Defining quality
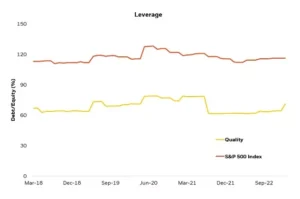
While there are varying definitions of quality, in a time of financial stress, we can define quality companies as those that have less exposure to interest rate risk—or low leverage, and companies that generate consistent, less volatile earnings over time. And as interest rates rise and capital becomes more scarce, we seek companies that are more efficient, which we can measure through Return on Equity (ROE). These are precisely the quality metrics that are used in the iShares MSCI USA Quality Factor ETF, QUAL, which seeks to provide exposure to the quality factor. QUAL’s benchmark index has persistently had higher profitability and lower leverage than the broad market.
QUAL vs. S&P 500 Index Return on equity and Leverage 2018-2023
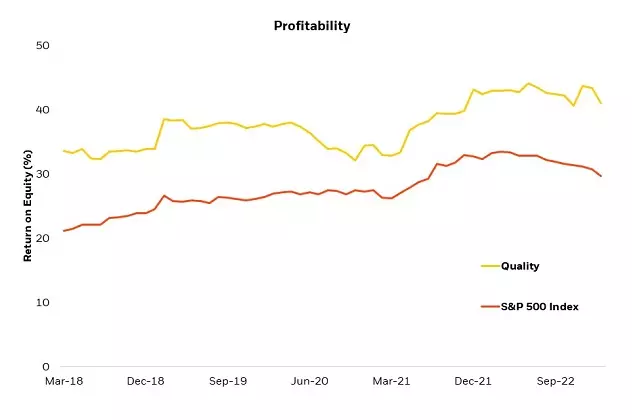
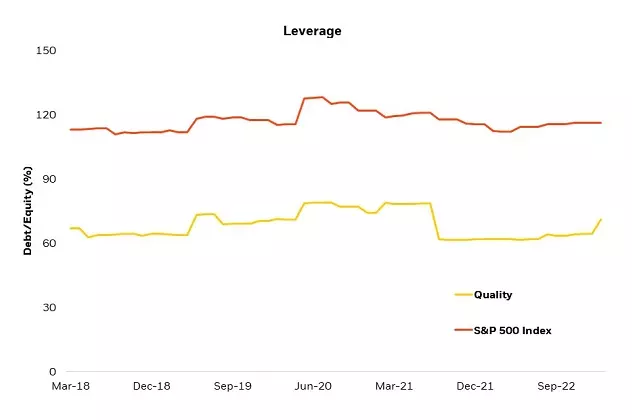
Source: Bloomberg, Morningstar Direct as of March 2018 – February 2023. Quality is proxied by the MSCI USA Sector Neutral Quality Index, which is the index that QUAL seeks to track. Profitability represented by Return on Equity (ROE). Leverage represented by total debt/total equity.
The consistent exposure over time to higher quality characteristics makes QUAL a potentially attractive choice for today’s market environment.
Sector constraints
One consideration when building a higher quality portfolio is underlying sector exposure. Certain factors are prone to sector biases. Value strategies tend to have a bias to financials, while unconstrained quality strategies tend to overweight technology due to tech firms generally having higher average profitability.6 By taking a sector neutral approach to quality, QUAL provides exposure to high quality companies in all sectors without taking sector bets.
It’s important to highlight that sector neutrality does not translate to industry neutrality. Intuitively, banks tend to have higher amounts of leverage given their business model. While QUAL’s benchmark index takes a sector neutral approach, it does not have any bank exposure due to the industry’s higher leverage.7
Quality vs. S&P 500 Index sector exposure as of February 2023
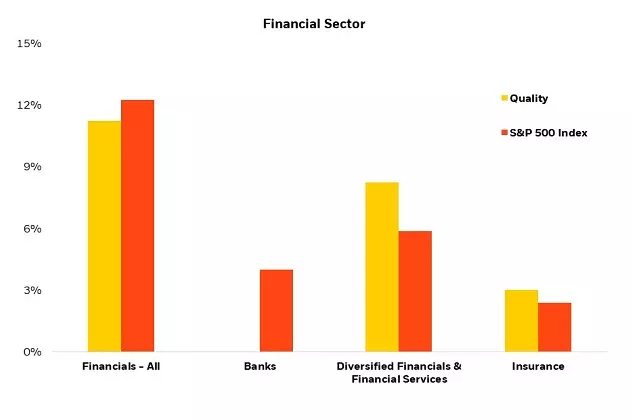
Source: FactSet as of 2/28/23. Quality represented by the MSCI USA Sector Neutral Quality Index.
As recent events have shown, higher leverage can be problematic in times of distress. By considering leverage as one signal for quality, QUAL may be better protected when the negative effects of excess leverage are punished.
Quality control
Over the long run, higher quality companies have historically outperformed their counterparts, which makes the case for long-term strategic exposure to the quality factor. But financial tumult, increased volatility, potentially slower growth, and risk-off sentiment, present increased opportunities for exposure to the quality factor today. While not as exciting as fast-moving momentum, or bargain shopping value, rising uncertainty is a good reminder that investors may want to consider adding some “quality control” in their portfolios.
Specific companies or issuers are mentioned for educational purposes only and should not be deemed as a recommendation to buy or sell any securities. Any companies mentioned do not necessarily represent current or future holdings of any BlackRock products. For actual ETF holdings, please visit a fund’s profile page on www.ishares.com. For QUAL’s holdings, please click here.
—
Originally Posted April 26, 2023 – Quality Control
© 2023 BlackRock, Inc. All rights reserved.
1 Hodges, Hogan, Peterson, Ang, “Factor Timing with Cross-Sectional and Time-Series Predictors”, Journal of Portfolio Management, Fall 2017.
2 The Federal Reserve as of March 2023. A basis point (bps) is one hundredth of one percent (e.g. one basis point = 0.01%).
3 Robert Novy-Marx, “The Other side of Value: The Gross Profitability Premium”, Journal of Financial Economics, April 2013; Eugene Fama, Ken French, “Profitability, investment, and average returns”, Journal of Financial Economics, December 2006; Richard Sloan, “Do Stock Prices Fully Reflect Information in Accruals and Cash Flows About Future Earnings”, The Accounting Review, July 1996.
4 Analysis by BlackRock using data from Ken French Data Library from July 1963 – January 2023. Spread in high profitability firms and low profitability firms calculated using RMW (robust minus weak). Profitability is measured by operating profitability. RMW is the average return on small+ big profitable companies minus the average return on small + big low profitable companies.
5 Quality as proxied by profitability.
6 As of 2/28/23, the Russell 1000 Value Index had a 21% weight to Financials compared to 12% in the Russell 1000 and S&P 500 Index. The MSCI USA Quality Index had a 41% weight to Information Technology compared to 28% in MSCI USA Sector Neutral Quality Index and 27% in the S&P 500 Index.
7 The MSCI USA Sector Neutral Quality Index has no bank exposure as of 2/28/23. The financial sector has an average Debt to Equity (D/E) ratio of 1. Banks had an average D/E of 2.5, implying higher leverage for the industry relative to the rest of financials.
Carefully consider the Funds’ investment objectives, risk factors, and charges and expenses before investing. This and other information can be found in the Funds’ prospectuses or, if available, the summary prospectuses, which may be obtained by visiting the iShares Fund and BlackRock Fund prospectus pages. Read the prospectus carefully before investing.
Investing involves risks, including possible loss of principal.
This material represents an assessment of the market environment as of the date indicated; is subject to change; and is not intended to be a forecast of future events or a guarantee of future results. This information should not be relied upon by the reader as research or investment advice regarding the funds or any issuer or security in particular.
This material contains general information only and does not take into account an individual’s financial circumstances. This information should not be relied upon as a primary basis for an investment decision. Rather, an assessment should be made as to whether the information is appropriate in individual circumstances and consideration should be given to talking to a financial professional before making an investment decision.
There can be no assurance that performance will be enhanced or risk will be reduced for funds that seek to provide exposure to certain quantitative investment characteristics (“factors”). Exposure to such investment factors may detract from performance in some market environments, perhaps for extended periods. In such circumstances, a fund may seek to maintain exposure to the targeted investment factors and not adjust to target different factors, which could result in losses. The iShares Minimum Volatility Funds may experience more than minimum volatility as there is no guarantee that the underlying index’s strategy of seeking to lower volatility will be successful.
Fixed income risks include interest-rate and credit risk. Typically, when interest rates rise, there is a corresponding decline in bond values. Credit risk refers to the possibility that the bond issuer will not be able to make principal and interest payments.
International investing involves risks, including risks related to foreign currency, limited liquidity, less government regulation and the possibility of substantial volatility due to adverse political, economic or other developments. These risks often are heightened for investments in emerging/ developing markets or in concentrations of single countries.
This information should not be relied upon as research, investment advice, or a recommendation regarding any products, strategies, or any security in particular. This material is strictly for illustrative, educational, or informational purposes and is subject to change.
The iShares Funds are not sponsored, endorsed, issued, sold or promoted by MSCI Inc., nor does this company make any representation regarding the advisability of investing in the Funds. BlackRock is not affiliated with MSCI Inc.
The iShares and BlackRock Funds are distributed by BlackRock Investments, LLC (together with its affiliates, “BlackRock”).
© 2023 BlackRock, Inc., or it’s affiliates. All Rights Reserved. BLACKROCK, iSHARES and ALADDIN are trademarks of BlackRock, Inc. or its affiliates. All other trademarks are those of their respective owners.
iCRMH0423U/S-2820363
Disclosure: BlackRock
©2022 BlackRock, Inc. All rights reserved. BLACKROCK is a registered trademark of BlackRock, Inc., or its subsidiaries in the United States and elsewhere. All other marks are the property of their respective owners.
Disclosure: Interactive Brokers
Information posted on IBKR Campus that is provided by third-parties does NOT constitute a recommendation that you should contract for the services of that third party. Third-party participants who contribute to IBKR Campus are independent of Interactive Brokers and Interactive Brokers does not make any representations or warranties concerning the services offered, their past or future performance, or the accuracy of the information provided by the third party. Past performance is no guarantee of future results.
This material is from BlackRock and is being posted with its permission. The views expressed in this material are solely those of the author and/or BlackRock and Interactive Brokers is not endorsing or recommending any investment or trading discussed in the material. This material is not and should not be construed as an offer to buy or sell any security. It should not be construed as research or investment advice or a recommendation to buy, sell or hold any security or commodity. This material does not and is not intended to take into account the particular financial conditions, investment objectives or requirements of individual customers. Before acting on this material, you should consider whether it is suitable for your particular circumstances and, as necessary, seek professional advice.


Join The Conversation
If you have a general question, it may already be covered in our FAQs. If you have an account-specific question or concern, please reach out to Client Services.