


This morning’s cautious outlook on household spending by Walmart alongside the highest levels of continuing unemployment claims in two years is bringing in bond bulls that seek to lock in current yields. Stocks are taking a break for the second-consecutive day, as investors hesitate to scoop up cyclical stocks amidst a technology sector that appears to have exhausted its upside. However, a potential continuation of weak economic data is likely to tempt market players to get ahead of themselves in anticipation of rate cuts from the Federal Reserve.
Labor Market Eases
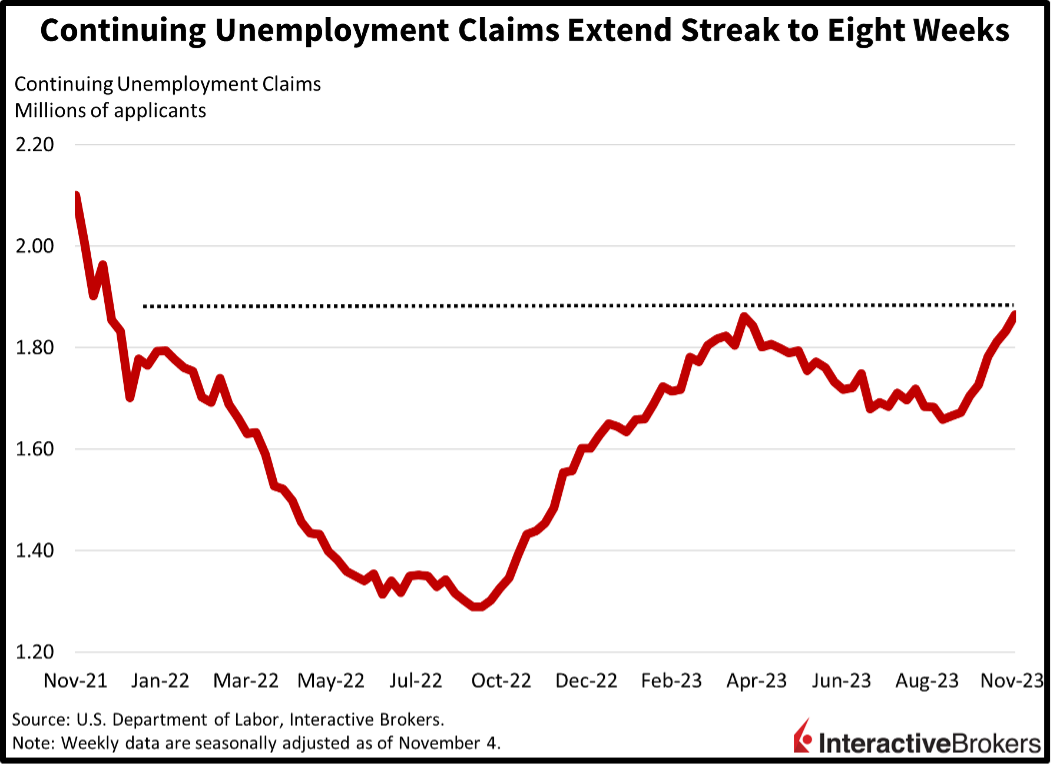
The labor market is continuing to ease with recurring unemployment claims for the week ended November 4 reaching the highest level since November 2021. Initial unemployment claims for the week ended November 11 also jumped, hitting the highest levels since this past August. Initial claims rose to 231,000, significantly above the 220,000 expected and the 218,000 recorded in the prior week. Additionally, continuing claims jumped to 1.865 million, higher than forecasts calling for 1.847 million and the 1.833 million in the previous period. While the labor market is slowly cooling, which is positive for dampening inflation, an accelerated slide would signal economic risk. Continuing claims need to stay below 2.2 million while initial claims must remain below 300,000 for soft landing prospects to flourish. So far, so good.
Proposed GM Union Agreements Faces Opposition
In other labor matters, voting by Union Auto Workers members to ratify proposed contracts with the nation’s three largest automobile manufacturers is continuing today, with observers noting that the outcome for General Motors employees may go down to the wire. Contracts for Ford and Stellantis workers are expected to be approved. The contracts provide various improvements to benefits and would increase wages 33% over time, resulting in top assembly lines workers receiving approximately $42 per hour by April of 2028. While the GM voting is too close to call, 66.1% of Ford union employees have voted in favor of the agreement and 66.5% of Stallantis workers have also voted to ratify the contracts. For GM, votes in favor of the contract exceed no votes by only 2,500. However, some 2,400 votes from the company’s Lansing, Michigan, factory haven’t been tallied. As of the last count, 61% of union workers at the facility voted to reject the agreement. Some union members don’t believe the contract’s immediate 11% wage increase is sufficient to make up for union concessions provided in 2008.
Other Companies Face Union Opposition
Automobile company employees aren’t the only ones upset, with workers at approximately 200 Starbucks stores expected to walk off the job today, which is Red Cup Day, an annual event in which the company gives away free reusable cups. It is one of Starbucks busiest days. Employees are seeking to unionize and are complaining that stores are understaffed. Meanwhile, members of the Coalition of Kaiser Permanente Unions have overwhelmingly voted to approve a new contract that would set the minimum hourly wages for California workers, where most of the health care provider facilities are located, at $25. Unions held a three-day strike prior to reaching the agreement. Also on the West Coast, scientists employed by California kicked off a three-day strike today in protest of not having a renewed contract. The contract expired three years ago. Additionally, the employees’ union, the California Association of Professional Scientists, is seeking what they believe is fair pay. Nearly 60% of the organization’s members voted to reject a proposed contract in February, sending members and state representatives back the negotiation table.
Corporate Earnings Reflect Consumer Caution
Quarterly earnings reports continue to reflect the impact upon consumers of steep interest rates, large credit card balances, tighter lending conditions and higher costs of living. In the corporate world, an earnings report from Palo Alto Networks, which provides cybersecurity, illustrates the impact of high interest rates on businesses.
In discussing quarterly results, Walmart Chief Financial Officer John David Rainey told CNBC that the company has seen a decline in sales prior to and after promotional events. Consumers are closely watching their spending and relying heavily on promotions. Additionally, sales weakened toward the end of its fiscal quarter ended October 31. During the quarter, the company generated $160.80 billion in revenue, exceeding the consensus expectation of $159.72 billion and climbing from $152.81 billion in the year-ago quarter. Walmart’s grocery shelves helped sustain foot traffic and its digital sales increased 24% in the U.S. Additionally, revenue from selling advertising space on the company’s ecommerce site grew 26% year-over-year (y/y). Walmart’s adjusted EPS of $1.53 exceeded the analyst consensus expectation of $1.52. In the year-ago quarter, it generated a $0.66 loss per share, a result of a settlement for pharmacy related issues. For the full year, Walmart increased its net sales guidance to a range of 5% to 5.5% and its EPS to a range of $6.40 to $6.48 while analysts expected EPS guidance of $6.48.
Macy’s, however, experienced a 7% y/y decline in sales with revenue dropping from $5.23 billion to $4.86 billion. Despite the decline, revenue exceeded the analyst expectation of $4.82 billion. Among Macy’s various brands, the Bluemercury beauty chain performed the best, with comparable sales increasing strongly. While many consumers with stretched finances are turning to off-price retailers, upper income shoppers appear less impacted by inflation with Macy’s higher end Bloomingdale’s chain store experiencing only a 3.2% comparable sales decline. Macy’s grew its earnings despite the decline in sales by lowering its inventory 6% and reducing its permanent markdowns on merchandise, which increased its gross margin from 38.7% to 40.3% y/y. As a result, the company’s quarterly adjusted EPS of $0.21 exceeded the consensus expectation of $0.0 but nevertheless declined from $0.52 in the year-ago quarter. In another positive development, Macy’s previously estimated that same-store sales would decline as much as 7.5% for the full year. It now expects a decline of no more than 7%. It also increased the lower end of its full-year revenue guidance from $22.8 billion to $22.9 billion and updated its adjusted EPS guidance range of between $2.70 and $3.20 to a range of $2.88 to $3.13.
Palo Alto generated third-quarter results that beat expectations, but the company’s guidance fell short of the analyst consensus expectation because the “high cost of money” has become a focus among businesses. For its fiscal first quarter ended October 31, Palo Alto generated an adjusted EPS of $1.38, exceeding the $1.16 expected by analysts and climbing 66% from the $0.83 in the year-ago quarter. Additionally, the company’s $1.9 billion in revenue grew 20% from the $1.56 billion produced in the year-ago quarter and beat the analyst expectation of $1.84 billion. After soaring approximately 85% year to date, Palo Alto stock dropped nearly 20% after the company provided disappointing billing guidance. The billing metric indicates the volume of sales and is used because of the lag between the signing of sales contracts and payments from clients. For the current quarter, Palo Alto expects billings to total $2.36 billion compared to the expectation for $2.41 billion. Its current quarter revenue of $1.97 billion, furthermore, only met analysts’ expectations.
Risk-off Trading
Risk-off sentiments are driving markets this morning with investors scooping up bonds while they sell-off economically cyclical stocks whose revenues and earnings underperform amidst softer consumer spending. All major U.S. equity indices are lower, with the small-cap, cyclically tilted Russell 2000 leading the way lower, it’s down 1.6%. The Dow Jones Industrial, Nasdaq Composite and S&P 500 indices are only down 0.3%, 0.3% and 0.1%, meanwhile. Sector breadth is poor, with all sectors lower except for the defensive health and utilities sectors. The energy sector is leading the way lower, it’s down 2.1% as crude oil prices, an important revenue driver for the sector, plunge. WTI crude oil is down 3.5% or $2.70 to $73.83 per barrel as concerns over rising U.S. inventories, slowing U.S. economic activity and weakening manufacturing production in China, the world’s largest importer of barrels, mount. Meanwhile, Treasuries are catching a bid, as investors brace for potential economic and financial market volatility. Yields on the 2- and 10-year maturities are down 8 and 9 basis points (bps) to 4.83% and 4.45%. The dollar is lower, as rising Fed rate cut wagers weigh on the currency, with the greenback’s index down 20 bps to 104.17. The U.S. currency is lower against the yen, euro, pound sterling, franc and yuan while it’s higher versus the Aussie and Canadian dollars.
Looking Ahead to The Real Estate Sector
Tomorrow’s data on housing starts and building permits are likely to reflect elevated caution by homebuilders. This month and next, however, real estate activity will begin to lift off, as lower interest rates unlock the sector’s potential. How much of this increased activity is inflationary will be top of mind, with renewed surges in price pressures compelling the Fed to stay on the market’s back. Stronger activity alongside decelerating inflation on the other hand, is what equity bulls need for further upside in stocks.
Visit Traders’ Academy to Learn More About Unemployment Claims and Other Economic Indicators.
Disclosure: Interactive Brokers
Information posted on IBKR Campus that is provided by third-parties does NOT constitute a recommendation that you should contract for the services of that third party. Third-party participants who contribute to IBKR Campus are independent of Interactive Brokers and Interactive Brokers does not make any representations or warranties concerning the services offered, their past or future performance, or the accuracy of the information provided by the third party. Past performance is no guarantee of future results.
This material is from IBKR Macroeconomics and is being posted with its permission. The views expressed in this material are solely those of the author and/or IBKR Macroeconomics and Interactive Brokers is not endorsing or recommending any investment or trading discussed in the material. This material is not and should not be construed as an offer to buy or sell any security. It should not be construed as research or investment advice or a recommendation to buy, sell or hold any security or commodity. This material does not and is not intended to take into account the particular financial conditions, investment objectives or requirements of individual customers. Before acting on this material, you should consider whether it is suitable for your particular circumstances and, as necessary, seek professional advice.


Join The Conversation
If you have a general question, it may already be covered in our FAQs. If you have an account-specific question or concern, please reach out to Client Services.