


- The current economic cycle is much shallower than the V-shaped GFC and Covid recessions.
- Structural G7 labour shortages and mild slowdowns jeopardise 2% inflation targets, particularly in the UK.
- Inflation Targeting Dilemma: Relaxing 2% targets during a significant overshoot is difficult.
- Central banks may be more cautious about easing rates, after the recent inflation shock.
- Return to “Old” Normal Rates and Yield Curve Insight. Without higher targets, a return to the pre-GFC, “old” normal of 3-6% policy rates becomes more plausible. Today’s inverted yield curves are reminiscent of Greenspan’s “conundrum”.
Ever since G7 central banks began tightening policy in 2022, markets have been pre-occupied by talk of “soft and hard landings “for growth and inflation. There has been less focus on what implications the type of economic cycle, and its causes, may have for the shape of the economic recovery, policy rates and the performance of different asset classes.
More specifically, does the policy-induced slowdown in GDP growth to date, with tight labour markets, mean a weak recovery, when it comes, and are labour shortages structural, not just cyclical? Do slow, gradual and shallow recessions and sticky inflation mean central bank easing will be slow and gradual as a result, and the era of zero interest rate policy (ZIRP) is effectively over?
G7 labour markets and causes of slowdown key to the cycle
In assessing these issues, both G7 labour markets and the causes of the slowdown are key. Despite weakness in manufacturing and interest rate sensitive sectors, there is little evidence of labour shedding to date. Fears of difficulty in hiring workers during an upturn may explain labour hoarding in the current slowdown phase.
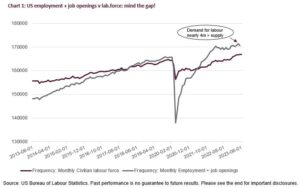
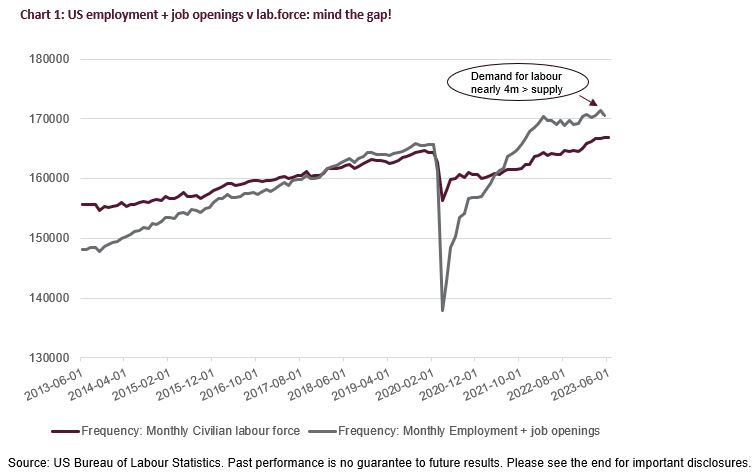
Post-Covid, the so-called “great resignation”, and ageing labour forces have created a structural shortage in US labour supply. Chart 1 shows excess demand for US workers, measured by employment and job openings, actually emerged modestly before Covid, and is now just under 4 million workers, versus the available labour force. Note that this labour shortage developed pre-Covid, but was largely concealed by the Covid recession, before becoming more acute in 2021/22.
Tightness in labour markets a G7-wide phenomenon
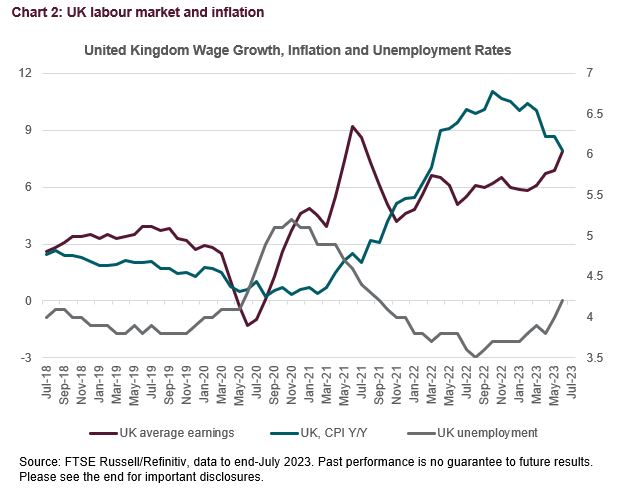
Tightness in labour markets is not confined to the US- it is evident in most G7 countries. As well as an ageing labour force, the UK labour market has been subject to a perfect storm of Brexit, the great resignation following Covid, and a surge in long-term disability claims[1] of 500,000 between 2019 and 2022. Chart 2 shows this has meant wage inflation has accelerated despite the economic slowdown, in 2022/23, and that wage inflation has almost doubled at about the same levels of unemployment since 2019.
But cost-push wage inflation pressures vary
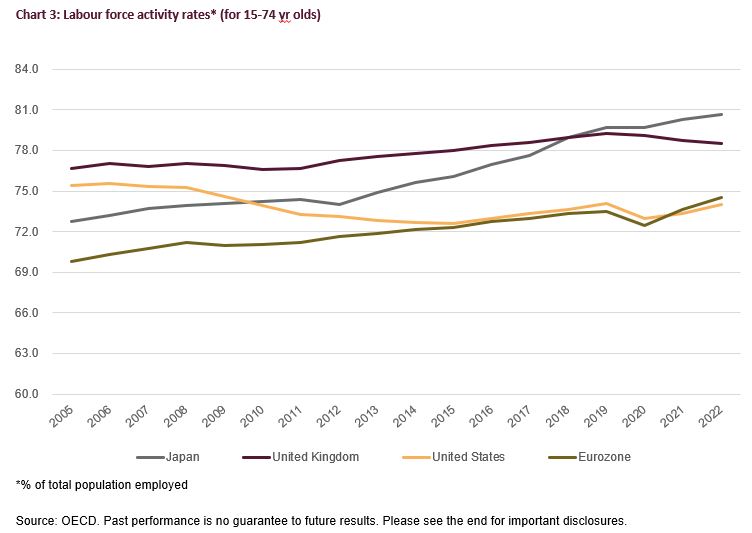
Structural labour market shortages in the G7 suggest “cost-push “pressures on inflation may persist, though the pattern is not uniform, as Chart 3 shows, with varying employment rates relative to population. Increased labour supply elasticity could pull more workers back into some labour forces, most notably in the US, where labour force activity, and participation rates, are still low. The failure of the UK activity rate to recover since Covid, plus increased healthcare waiting lists, and labour militancy suggests more acute UK labour supply issues than the rest of the G7. In contrast, higher activity rates in Japan and Eurozone show improved labour supply elasticity, after market reforms, most notably in Japan. This may dampen wage pressure.
Labour shortages and hoarding may deliver a slow, U-shaped cycle…
Labour shortages have important implications for the shape of the business cycle. Reduced labour shedding in a downturn, due to shortages, may prevent a spike in unemployment, collapse in demand and deeper recession, while also dampening the demand for labour during the upswing. This tends to make the economic contraction more modest, and the cycle shallower. In addition, structurally, reduced labour supply constrains potential, non-inflationary GDP growth, unless offset by faster technological progress[2].
..combined with the energy shock and policy tightening
Other key drivers of the current cycle have been an exogenous energy shock, and policy tightening by central banks’, to reduce inflation. These are very different drivers from the global financial crisis (GFC) recession and Covid business cycles, which were exogenous and severe deflationary shocks; one a major credit crunch in the financial system, and the other a pandemic driven enforced Lockdown of activity.
2023 slowdown very different from GFC or Covid shocks
Chart 4 shows these deflationary shocks drove rapid, V-shaped recessions and recoveries in the US and UK, characterised by severe contractions in economic activity, spikes in unemployment, and damage to global supply-chains. Policymakers responded quickly with zero rates, and substantial Quantitative Easing, and fiscal support, driving significant rebounds in demand, and economic activity (also boosted by base effects).
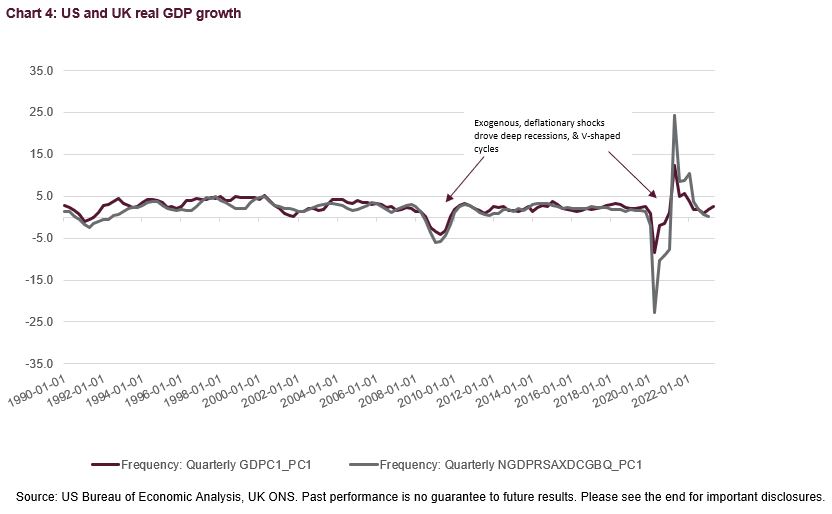
The Chart shows both the profile, and speed of the economic cycles were very different from the current and earlier cycles. As a result, inferences drawn from recent fast-moving, V-shaped cycles for monetary and fiscal policy, interest rates and asset valuations may be inappropriate for a slow-motion, shallow economic cycle.
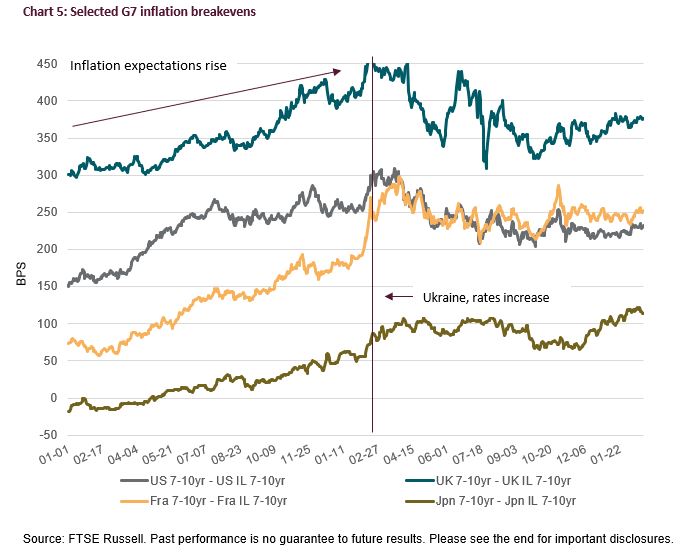
Central banks also more risk-averse after 2021-22?
The reaction function of central banks may have changed also. Covid and the recent inflation rebound raised questions about the appropriateness of using GFC policies of zero rates, and QE to revive growth, and whether the stimulus was left in place too long? Enforced Lockdown recessions were very different from the GFC credit crunch and fiscal policy also supported employment via furlough schemes during Covid.
So perhaps it is unsurprising that, as Chart 5 shows, inflation expectations rose steadily after central bank QE in March 2020, and did not stabilise until they finally began raising rates in early-2022. Given this history, greater reluctance to ease rates quickly can be expected from central banks, and particularly the Bank of England, given the scale of the UK inflation overshoot (currently 6.8% y/y versus the 2% target).
It would be difficult to introduce higher inflation targets now, even if more appropriate, because inflation is well above target and doing so risks de-stabilising inflation expectations.
Without higher targets, return to a new “old” normal on rates?
So, if higher inflation targets are not feasible, and labour shortages delay disinflation, the prospect of a new “old” normal of 3-6% on policy rates becomes more plausible. Also note that flat, or inverted yield curves were typical of the pre-GFC period: a phenomenon described as a conundrum by Fed Chairman Greenspan[3], in 2005.
—
Originally Posted August 25, 2023 – The shape of things to come – is the era of G7 zero rates over ?
For more information subscribe to our blog
[1] Source: UK ONS data, July 2023
[2] In neo-classical growth models, beginning with Solow et al, from 1956.
[3] Alan Greenspan, Fed Chairman’s Congressional testimony, February 2005.
Disclosure: FTSE Russell
Interactive Advisors, a division of Interactive Brokers Group, offers FTSE Russell Index Tracker portfolios on its online investing marketplace. Learn more about the Diversified Portfolios.
This material is not intended as investment advice. Interactive Advisors or portfolio managers on its marketplace may hold long or short positions in the companies mentioned through stocks, options or other securities.
© 2023 London Stock Exchange Group plc and its applicable group undertakings (the “LSE Group”). The LSE Group includes (1) FTSE International Limited (“FTSE”), (2) Frank Russell Company (“Russell”), (3) FTSE Global Debt Capital Markets Inc. and FTSE Global Debt Capital Markets Limited (together, “FTSE Canada”), (4) MTSNext Limited (“MTSNext”), (5) Mergent, Inc. (“Mergent”), (6) FTSE Fixed Income LLC (“FTSE FI”), (7) The Yield Book Inc (“YB”) and (8) Beyond Ratings S.A.S. (“BR”). All rights reserved.
FTSE Russell® is a trading name of FTSE, Russell, FTSE Canada, MTSNext, Mergent, FTSE FI, YB and BR. “FTSE®”, “Russell®”, “FTSE Russell®”, “MTS®”, “FTSE4Good®”, “ICB®”, “Mergent®”, “The Yield Book®”, “Beyond Ratings®“ and all other trademarks and service marks used herein (whether registered or unregistered) are trademarks and/or service marks owned or licensed by the applicable member of the LSE Group or their respective licensors and are owned, or used under licence, by FTSE, Russell, MTSNext, FTSE Canada, Mergent, FTSE FI, YB or BR. FTSE International Limited is authorised and regulated by the Financial Conduct Authority as a benchmark administrator.
All information is provided for information purposes only. All information and data contained in this publication is obtained by the LSE Group, from sources believed by it to be accurate and reliable. Because of the possibility of human and mechanical error as well as other factors, however, such information and data is provided “as is” without warranty of any kind. No member of the LSE Group nor their respective directors, officers, employees, partners or licensors make any claim, prediction, warranty or representation whatsoever, expressly or impliedly, either as to the accuracy, timeliness, completeness, merchantability of any information or of results to be obtained from the use of the FTSE Russell products, including but not limited to indexes, data and analytics or the fitness or suitability of the FTSE Russell products for any particular purpose to which they might be put. Any representation of historical data accessible through FTSE Russell products is provided for information purposes only and is not a reliable indicator of future performance.
No responsibility or liability can be accepted by any member of the LSE Group nor their respective directors, officers, employees, partners or licensors for (a) any loss or damage in whole or in part caused by, resulting from, or relating to any error (negligent or otherwise) or other circumstance involved in procuring, collecting, compiling, interpreting, analysing, editing, transcribing, transmitting, communicating or delivering any such information or data or from use of this document or links to this document or (b) any direct, indirect, special, consequential or incidental damages whatsoever, even if any member of the LSE Group is advised in advance of the possibility of such damages, resulting from the use of, or inability to use, such information.
No member of the LSE Group nor their respective directors, officers, employees, partners or licensors provide investment advice and nothing contained herein or accessible through FTSE Russell products, including statistical data and industry reports, should be taken as constituting financial or investment advice or a financial promotion.
Past performance is no guarantee of future results. Charts and graphs are provided for illustrative purposes only. Index returns shown may not represent the results of the actual trading of investable assets. Certain returns shown may reflect back-tested performance. All performance presented prior to the index inception date is back-tested performance. Back-tested performance is not actual performance, but is hypothetical. The back-test calculations are based on the same methodology that was in effect when the index was officially launched. However, back- tested data may reflect the application of the index methodology with the benefit of hindsight, and the historic calculations of an index may change from month to month based on revisions to the underlying economic data used in the calculation of the index.
This document may contain forward-looking assessments. These are based upon a number of assumptions concerning future conditions that ultimately may prove to be inaccurate. Such forward-looking assessments are subject to risks and uncertainties and may be affected by various factors that may cause actual results to differ materially. No member of the LSE Group nor their licensors assume any duty to and do not undertake to update forward-looking assessments.
No part of this information may be reproduced, stored in a retrieval system or transmitted in any form or by any means, electronic, mechanical, photocopying, recording or otherwise, without prior written permission of the applicable member of the LSE Group. Use and distribution of the LSE Group data requires a licence from FTSE, Russell, FTSE Canada, MTSNext, Mergent, FTSE FI, YB, BR and/or their respective licensors.
Disclosure: Interactive Brokers
Information posted on IBKR Campus that is provided by third-parties does NOT constitute a recommendation that you should contract for the services of that third party. Third-party participants who contribute to IBKR Campus are independent of Interactive Brokers and Interactive Brokers does not make any representations or warranties concerning the services offered, their past or future performance, or the accuracy of the information provided by the third party. Past performance is no guarantee of future results.
This material is from FTSE Russell and is being posted with its permission. The views expressed in this material are solely those of the author and/or FTSE Russell and Interactive Brokers is not endorsing or recommending any investment or trading discussed in the material. This material is not and should not be construed as an offer to buy or sell any security. It should not be construed as research or investment advice or a recommendation to buy, sell or hold any security or commodity. This material does not and is not intended to take into account the particular financial conditions, investment objectives or requirements of individual customers. Before acting on this material, you should consider whether it is suitable for your particular circumstances and, as necessary, seek professional advice.


Join The Conversation
If you have a general question, it may already be covered in our FAQs. If you have an account-specific question or concern, please reach out to Client Services.