


Does investor behavior change when markets get more volatile?
We analyzed over 450 client portfolios to gain insight into how investors behave and adjust their portfolios in challenging markets. We compared 2021 and 2022 portfolio allocations to their strategic benchmarks using our Portfolio Insights Analysis.
This analysis by the SPDR Americas Research Team evaluates the asset classes, security types, sectors, and duration of a portfolio — to reveal a portfolio’s exposures and any potential risks that may have been overlooked.
So, how did clients adjust allocations as volatility increased? Six clear trends emerged.
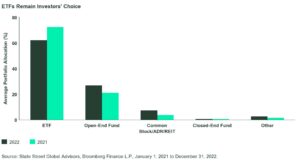
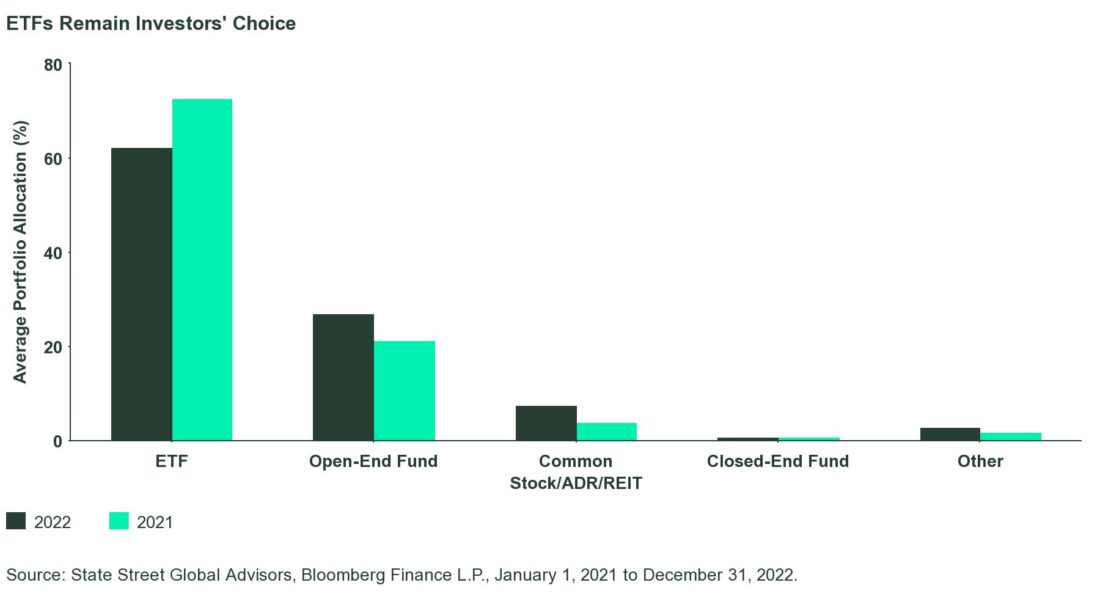
1. Exchange Traded Funds (ETFs) Remained the Top Choice
In 2021 and 2022, clients kept their largest allocation in ETFs. On average, ETFs comprised 72.83% of portfolios in 2021 and 62.28% in 2022.
Our Take
ETFs were the predominant investment vehicle for our clients’ portfolios in 2021 and 2022. This is likely because they offer increased diversification and transparency, lower costs, added liquidity, and greater trading flexibility.
In 2022, investors also increased allocations to stocks, REITs, and ADRs as well as to open-ended funds for active management, fixed income, and alternative allocations.
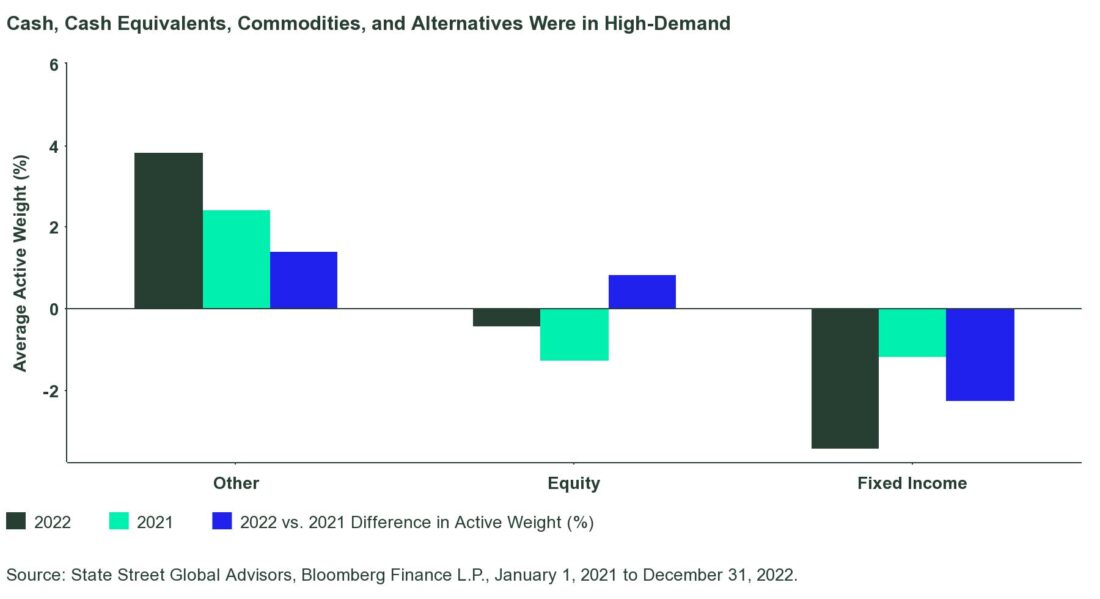
2. Fixed Income Allocations Declined
It’s no surprise that fixed income fell out of favor in 2022. The Federal Reserve raised the fed funds rate from a near-zero level to 4.375%. This tightening cycle had a negative effect on most fixed income investments, because of the inverse price-to-interest rate relationship.
In response, clients adjusted their allocations by:
- Deepening active fixed income by -3.42%.
- Increasing equity exposures to a -0.42% underweight (from -1.26%).
- Increasing average active weight in cash, cash equivalents, commodities, and alternatives to an overweight of 3.84%.
Our Take
In response to hawkish monetary policy, investors cut their fixed income allocations to limit the negative price impact (duration effect). At the same time, they searched for safe-havens like cash, T-bills, alternatives, and commodities (gold). Given the 2022 twin bear market, with both stocks and bonds underwater, investors turned their attention to alternative investments.
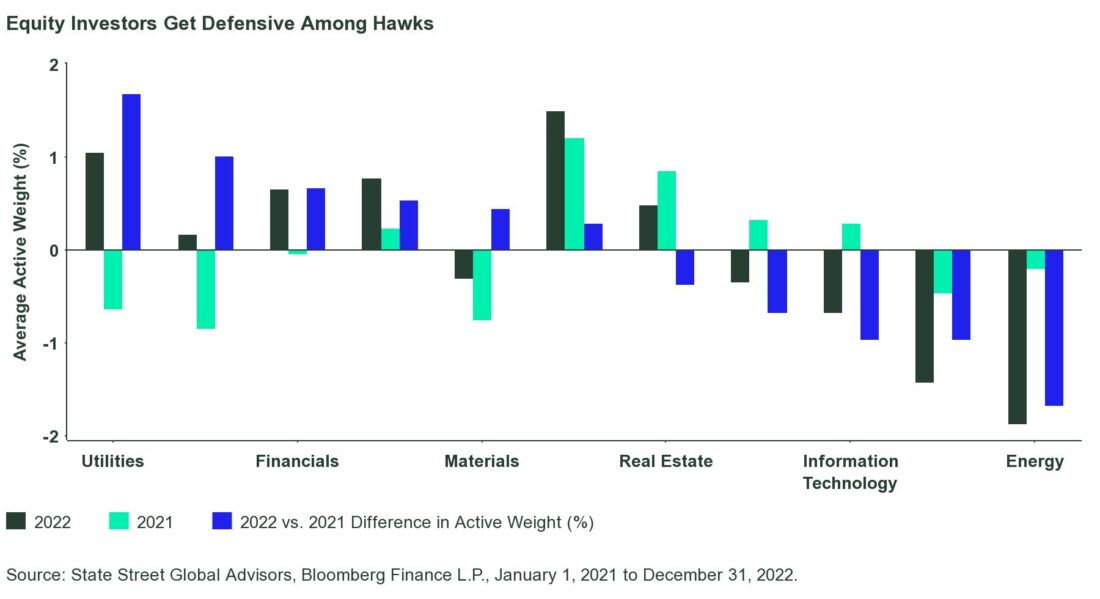
3. Equity Positioning Got Defensive
2022 was an equally unpleasant year for stocks, as increasing interest rates impacted the cost of capital and equity valuations.
Investors increased their investments in defensive sectors. Utilities saw the largest year-on-year increase, rising from a 0.64% underweight to a 1.05% overweight. Investors also increased their allocations to Industrials by 1.01% and Financials by 0.67%. Consumer Discretionary remained investors’ strongest allocation, with a 1.21% overweight in 2021 and 1.50% in 2022.
Investors were consistent with their underweights year-on-year, underweighting Energy by 1.88% and Telecoms by -1.43% in 2022. Tech went from a 0.29% overweight in 2021 to a 0.67% underweight in 2022.
Our Take
Investors made tactical allocations to capture market trends, guided by sectors’ cyclicality and dispersion of returns. With a wide array of factors moving markets, sector positioning in 2022 reflected multiple catalysts. Investors overweighted Utilities due to their defensive nature, as well as Industrials due to global supply chain easing. At the same time, intensifying geopolitical tensions increased the demand for Aerospace & Defense (Industrials subset).
We believe the Energy sector’s underweight was due to profit-taking after a long period of rising oil prices. Our view is that cyclicals’ underweight is a result of increasing cost of capital and decreasing growth prospects.
Click here to read the full article
—
Originally Posted June 22, 2023 – What Portfolio Analysis Reveals About Investor Behavior
Disclosure
Important Risk Information
Frequent trading of ETFs could significantly increase commissions and other costs, such that they may offset any savings from low fees or costs.
These investments may have difficulty in liquidating an investment position without taking a significant discount from current market value, which can be a significant problem with certain lightly traded securities.
Investing involves risk, including the risk of loss of principal.
The whole or any part of this work may not be reproduced, copied or transmitted or any of its contents disclosed to third parties without SSGA’s express written consent.
The information provided does not constitute investment advice and it should not be relied on as such. It should not be considered a solicitation to buy or an offer to sell a security. It does not take into account any investor’s particular investment objectives, strategies, tax status or investment horizon. You should consult your tax and financial advisor. All information is from SSGA unless otherwise noted and has been obtained from sources believed to be reliable, but its accuracy is not guaranteed. There is no representation or warranty as to the current accuracy, reliability or completeness of, nor liability for, decisions based on such information, and it should not be relied on as such.
Bonds generally present less short-term risk and volatility than stocks but contain interest rate risk (as interest rates raise, bond prices usually fall); issuer default risk; issuer credit risk; liquidity risk; and inflation risk. These effects are usually pronounced for longer-term securities. Any fixed income security sold or redeemed prior to maturity may be subject to a substantial gain or loss.
Equity securities may fluctuate in value in response to the activities of individual companies and general market and economic conditions.
Diversification does not ensure a profit or guarantee against loss.
There can be no assurance that a liquid market will be maintained for ETF shares.
Disclosure: State Street Global Advisors
Do not reproduce or reprint without the written permission of SSGA.
All information has been obtained from sources believed to be reliable, but its accuracy is not guaranteed. There is no representation or warranty as to the current accuracy, reliability or completeness of, nor liability for, decisions based on such information and it should not be relied on as such.
State Street Global Advisors and its affiliates (“SSGA”) have not taken into consideration the circumstances of any particular investor in producing this material and are not making an investment recommendation or acting in fiduciary capacity in connection with the provision of the information contained herein.
ETFs trade like stocks, are subject to investment risk, fluctuate in market value and may trade at prices above or below the ETF’s net asset value. Brokerage commissions and ETF expenses will reduce returns.
Bonds generally present less short-term risk and volatility than stocks, but contain interest rate risk (as interest rates raise, bond prices usually fall); issuer default risk; issuer credit risk; liquidity risk; and inflation risk. These effects are usually pronounced for longer-term securities. Any fixed income security sold or redeemed prior to maturity may be subject to a substantial gain or loss.
Investing involves risk including the risk of loss of principal.
The whole or any part of this work may not be reproduced, copied or transmitted or any of its contents disclosed to third parties without SSGA’s express written consent.
Investing in high yield fixed income securities, otherwise known as “junk bonds”, is considered speculative and involves greater risk of loss of principal and interest than investing in investment grade fixed income securities. These Lower-quality debt securities involve greater risk of default or price changes due to potential changes in the credit quality of the issuer.
COPYRIGHT AND OTHER RIGHTS
Other third party content is the intellectual property of the respective third party and all rights are reserved to them. All rights reserved. No organization or individual is permitted to reproduce, distribute or otherwise use the statistics and information in this report without the written agreement of the copyright owners.
Definition:
Arbitrage: the simultaneous buying and selling of securities, currency, or commodities in different markets or in derivative forms in order to take advantage of differing prices for the same asset.
Fund Objectives:
SPY: The investment seeks to provide investment results that, before expenses, correspond generally to the price and yield performance of the S&P 500® Index. The Trust seeks to achieve its investment objective by holding a portfolio of the common stocks that are included in the index (the “Portfolio”), with the weight of each stock in the Portfolio substantially corresponding to the weight of such stock in the index.
VOO: The investment seeks to track the performance of a benchmark index that measures the investment return of large-capitalization stocks. The fund employs an indexing investment approach designed to track the performance of the Standard & Poor’s 500 Index, a widely recognized benchmark of U.S. stock market performance that is dominated by the stocks of large U.S. companies. The advisor attempts to replicate the target index by investing all, or substantially all, of its assets in the stocks that make up the index, holding each stock in approximately the same proportion as its weighting in the index.
IVV: The investment seeks to track the investment results of the S&P 500 (the “underlying index”), which measures the performance of the large-capitalization sector of the U.S. equity market. The fund generally invests at least 90% of its assets in securities of the underlying index and in depositary receipts representing securities of the underlying index. It may invest the remainder of its assets in certain futures, options and swap contracts, cash and cash equivalents, as well as in securities not included in the underlying index, but which the advisor believes will help the fund track the underlying index.
The funds presented herein have different investment objectives, costs and expenses. Each fund is managed by a different investment firm, and the performance of each fund will necessarily depend on the ability of their respective managers to select portfolio investments. These differences, among others, may result in significant disparity in the funds’ portfolio assets and performance. For further information on the funds, please review their respective prospectuses.
Entity Disclosures:
The trademarks and service marks referenced herein are the property of their respective owners. Third party data providers make no warranties or representations of any kind relating to the accuracy, completeness or timeliness of the data and have no liability for damages of any kind relating to the use of such data.
SSGA Funds Management, Inc. serves as the investment advisor to the SPDR ETFs that are registered with the United States Securities and Exchange Commission under the Investment Company Act of 1940. SSGA Funds Management, Inc. is an affiliate of State Street Global Advisors Limited.
Intellectual Property Disclosures:
Standard & Poor’s®, S&P® and SPDR® are registered trademarks of Standard & Poor’s® Financial Services LLC (S&P); Dow Jones is a registered trademark of Dow Jones Trademark Holdings LLC (Dow Jones); and these trademarks have been licensed for use by S&P Dow Jones Indices LLC (SPDJI) and sublicensed for certain purposes by State Street Corporation. State Street Corporation’s financial products are not sponsored, endorsed, sold or promoted by SPDJI, Dow Jones, S&P, their respective affiliates and third party licensors and none of such parties make any representation regarding the advisability of investing in such product(s) nor do they have any liability in relation thereto, including for any errors, omissions, or interruptions of any index.
BLOOMBERG®, a trademark and service mark of Bloomberg Finance, L.P. and its affiliates, and BARCLAYS®, a trademark and service mark of Barclays Bank Plc., have each been licensed for use in connection with the listing and trading of the SPDR Bloomberg Barclays ETFs.
Distributor: State Street Global Advisors Funds Distributors, LLC, member FINRA, SIPC, an indirect wholly owned subsidiary of State Street Corporation. References to State Street may include State Street Corporation and its affiliates. Certain State Street affiliates provide services and receive fees from the SPDR ETFs.
ALPS Distributors, Inc., member FINRA, is distributor for SPDR® S&P 500®, SPDR® S&P MidCap 400® and SPDR® Dow Jones Industrial Average, all unit investment trusts. ALPS Distributors, Inc. is not affiliated with State Street Global Advisors Funds Distributors, LLC.
Before investing, consider the funds’ investment objectives, risks, charges, and expenses. For SPDR funds, you may obtain a prospectus or summary prospectus containing this and other information by calling 1‐866‐787‐2257 or visiting www.spdrs.com. Please read the prospectus carefully before investing.
Disclosure: Interactive Brokers
Information posted on IBKR Campus that is provided by third-parties does NOT constitute a recommendation that you should contract for the services of that third party. Third-party participants who contribute to IBKR Campus are independent of Interactive Brokers and Interactive Brokers does not make any representations or warranties concerning the services offered, their past or future performance, or the accuracy of the information provided by the third party. Past performance is no guarantee of future results.
This material is from State Street Global Advisors and is being posted with its permission. The views expressed in this material are solely those of the author and/or State Street Global Advisors and Interactive Brokers is not endorsing or recommending any investment or trading discussed in the material. This material is not and should not be construed as an offer to buy or sell any security. It should not be construed as research or investment advice or a recommendation to buy, sell or hold any security or commodity. This material does not and is not intended to take into account the particular financial conditions, investment objectives or requirements of individual customers. Before acting on this material, you should consider whether it is suitable for your particular circumstances and, as necessary, seek professional advice.
Disclosure: ETFs
Any discussion or mention of an ETF is not to be construed as recommendation, promotion or solicitation. All investors should review and consider associated investment risks, charges and expenses of the investment company or fund prior to investing. Before acting on this material, you should consider whether it is suitable for your particular circumstances and, as necessary, seek professional advice.
Disclosure: Complex or Leveraged Exchange-Traded Products
Complex or Leveraged Exchange-Traded Products are complicated instruments that should only be used by sophisticated investors who fully understand the terms, investment strategy, and risks associated with the products. Learn more about the risks here: https://gdcdyn.interactivebrokers.com/Universal/servlet/Registration_v2.formSampleView?formdb=4155


Join The Conversation
If you have a general question, it may already be covered in our FAQs. If you have an account-specific question or concern, please reach out to Client Services.