


NVDA’s Impressive Run and Options Activity Today
With NVDA witnessing a 4.7% rise amidst unusual option volume this afternoon, option traders could be eyeing a potential bullish call opportuntiy, especially in the final trading hour.

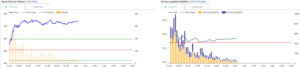
NVDA Chart side by side of stock and options volume.
Considering a Bullish NVDA Call Trade as the Market Closes? Key Questions to Guide You
When you are contemplating a call option trade, you are primarily concerned about the stock’s direction and option’s premium. From this perspective, you may look to historical data to help answer some important questions like:
Do NVDA’s average returns in the final hour demonstrate a positive trend? Such a pattern may suggest a historical bias in favor of bullish call options.
What’s the frequency of upward movements? This helps in assessing the historical probability of a price increase.
What is the average magnitude of upward movements? Understanding this helps evaluate if potential gains can offset the option premium.
Where Can You Find Intraday Stock Analysis for NVDA?
To analyze NVDA’s intraday stock movements, historical data is essential. We’ll utilize MarketChameleon’s NVDA intraday stock analysis tool for this purpose. It’s designed to provide deep insights into NVDA’s typical trading behavior. This will assist us in addressing the vital questions raised earlier.
Setting Up The Intraday Analysis for NVDA

To obtain the most relevant statistics for our analysis, it’s crucial to carefully select our data set. We will focus on the last hour of trading, setting our timeframe from 3 to 4 pm. This period often sees significant market activity, making it a critical window for analysis.
Additionally, since our analysis is being conducted on a Monday, we’ll tailor our data to specifically include Mondays’ trading patterns. This day-specific approach allows us to capture any unique trends that might emerge at the start of the trading week.
Remember, while we’re focusing on Monday in this instance, this method can be adapted to analyze any day of the week, offering flexibility in your trading strategy.
We Ran NVDA’s Final Hour Stock Analysis. Here are the results.
Source: Market Chameleon
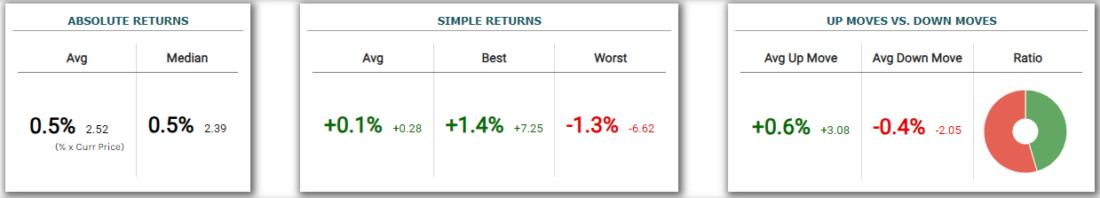
- NVDA’s Absolute Returns
NVDA’s Absolute Returns show an average move of 0.5% in either direction, roughly $2.52 (using the stock price as of this analysis), illustrating the potential for volatility. The median move is similar, at 0.5% or $2.39.
This data is vital for comparing expected stock moves with expected option time decay.
- Simple Returns
NVDA shows an average increase of +0.1%. This suggests a slight tendency for the stock to gain in the final trading hour.
The historical extremes for NVDA are +1.4% and -1.3%, respectively. This indicates that the stock’s most significant movements tended to be more positive.
Overall, these simple returns suggest that NVDA’s stock behavior leans slightly towards the bullish side, especially considering the skew towards higher peaks in its performance.
- Up vs. Down Moves
NVDA’s average upward movement is +0.6%, while its average downward movement is -0.4%. This difference suggests that NVDA’s upward movements are generally stronger than its downward ones. Such a trend could favor a call option, especially in scenarios of market volatility, due to the higher average magnitude of upward shifts.
- Frequency of Up vs Down Moves
A pie chart illustrates that NVDA stocks dip 55% of the time in the final hour, suggesting that while up moves are generally larger, down moves occur more frequently.
In Conclusion
Our comprehensive analysis of NVDA’s stock behavior in the final trading hour offers valuable insights for traders considering call options. The data reveals a slight average increase in NVDA’s stock price, with more significant upward movements than downward ones, albeit with a higher frequency of declines. These findings suggest a nuanced market behavior: while NVDA shows a tendency towards bullish movements in terms of magnitude, the regularity of downward trends cannot be overlooked.
For traders, this means balancing the potential for higher gains against the prevalent risks of declines. The key takeaway is the importance of a strategic approach, considering both the volatility and the historical trends of NVDA’s stock. As always, while historical data can guide decisions, historical data does not guarantee any future results and it’s crucial to stay informed about current market conditions and broader economic factors that might influence stock performance.
Contact Information:
If you have feedback or concerns about the content, please feel free to reach out to us via email at support@marketchameleon.com.
—
Originally Posted January 8, 2024 – Are You Considering An NVDA Call Option In The Final Hour Of Trading? Here Are Some Key Benchmarks
NOTE: Stock and option trading involves risk that may not be suitable for all investors. Examples contained within this report are simulated And may have limitations. Average returns and occurrences are calculated from snapshots of market mid-point prices And were Not actually executed, so they do not reflect actual trades, fees, or execution costs. This report is for informational purposes only, and is not intended to be a recommendation to buy or sell any security. Neither Market Chameleon nor any other party makes warranties regarding results from its usage. Past performance does not guarantee future results. Please consult a financial advisor before executing any trades. You can read more about option risks and characteristics at theocc.com.
The information is provided for informational purposes only and should not be construed as investment advice. All stock price information is provided and transmitted as received from independent third-party data sources. The Information should only be used as a starting point for doing additional independent research in order to allow you to form your own opinion regarding investments and trading strategies. The Company does not guarantee the accuracy, completeness or timeliness of the Information.
Disclosure: Market Chameleon
The information provided on MarketChameleon is for educational and informational purposes only. It should not be considered as financial or investment advice. Trading and investing in financial markets involve risks, and individuals should carefully consider their own financial situation and consult with a professional advisor before making any investment decisions. MarketChameleon does not guarantee the accuracy, completeness, or reliability of the information provided, and users acknowledge that any reliance on such information is at their own risk. MarketChameleon is not responsible for any losses or damages resulting from the use of the platform or the information provided therein. The 7-day free trial is offered for evaluation purposes only, and users are under no obligation to continue using the service after the trial period.
Disclosure: Interactive Brokers
Information posted on IBKR Campus that is provided by third-parties does NOT constitute a recommendation that you should contract for the services of that third party. Third-party participants who contribute to IBKR Campus are independent of Interactive Brokers and Interactive Brokers does not make any representations or warranties concerning the services offered, their past or future performance, or the accuracy of the information provided by the third party. Past performance is no guarantee of future results.
This material is from Market Chameleon and is being posted with its permission. The views expressed in this material are solely those of the author and/or Market Chameleon and Interactive Brokers is not endorsing or recommending any investment or trading discussed in the material. This material is not and should not be construed as an offer to buy or sell any security. It should not be construed as research or investment advice or a recommendation to buy, sell or hold any security or commodity. This material does not and is not intended to take into account the particular financial conditions, investment objectives or requirements of individual customers. Before acting on this material, you should consider whether it is suitable for your particular circumstances and, as necessary, seek professional advice.
Disclosure: Options Trading
Options involve risk and are not suitable for all investors. Multiple leg strategies, including spreads, will incur multiple commission charges. For more information read the "Characteristics and Risks of Standardized Options" also known as the options disclosure document (ODD) or visit ibkr.com/occ


Join The Conversation
If you have a general question, it may already be covered in our FAQs. If you have an account-specific question or concern, please reach out to Client Services.