


The put/call ratio is a popular metric. We take the volume of put options and divide it by the volume of call options. Simple arithmetic is easy for people to understand. Interpreting that simple ratio is quite another thing, however.
Many of us tend to look at the put/call ratio as a contrary indicator. The logic is that when people are flocking to puts, the risks that they are attempting to either hedge or profit from are largely behind us. Taken another way, a surge of put buying is believed to signal the latter phases of a downdraft rather than its start. At some level that is dismissive of the market’s ability to properly foresee events. In theory, an omniscient — or simply efficient — market should experience an influx of put buying before a downward move, not after. In reality though, we tend to see measures like the Cboe Volatility Index (VIX) peak just around the culmination of a sell-off. Too many investors have a nasty habit of closing the proverbial barn door just after the horse has left.
Another issue with the put/call ratio is how to construct it. We can use single-stock and ETF options volumes or index options volumes. We can focus on a single exchange or accumulate the volumes from across all 16 US options exchanges[i]. The choices can be overwhelming.
I prefer to use a 21-day moving average of the put/call volumes across all exchanges. A moving average is very helpful, because the daily readings can be quite noisy. There are roughly 21 trading days in a month, so I find that to be a useful way to discern intermediate-length trends. And I prefer to use all-exchange volume because it seems unnecessarily restrictive to focus on one exchange when there are so many venues. There is a rationale for using Cboe as a proxy for index activity because of their exclusive contracts with S&P Global (SPGI), but much less for a broad look at options activity.
A reporter whom I respect contacted me yesterday, asking for comment about why the 20-day moving average of the CBOE put/call ratio was at levels not seen since April 2020. I was glad for the question, because it’s a phenomenon I’ve been noticing in my work, as evident in the graph below:
All Exchange Put/Call Ratio (OPCVTPCR, white), with 21-day Moving Average (magenta) and S&P 500 Index (orange), 2020-present
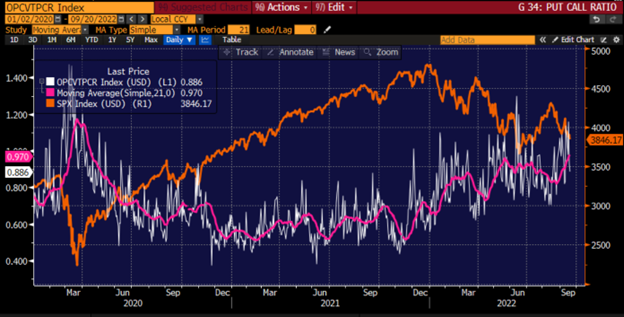
Source: Bloomberg
It is indeed evident that the put/call ratio has been rising steadily as the market has been undergoing some rocky times. We also see that the prior peak in the moving average would have been an ideal buying opportunity. (We also see that the daily readings are incredibly noisy). That said, I assert that this view tells only a small fraction of the story.
A longer-term view shows us that the 2020-21 period was actually the anomaly. The ratio is only recently returning to the normal levels seen prior to the post-Covid bull market. During that time, traders became enamored with call speculation, depressing the denominator of the put/call ratio (we’ve removed the noisy daily data):
21-day Moving Average (magenta) of All Exchange Put/Call Ratio (OPCVTPCR), with S&P 500 Index (orange), 2017-present
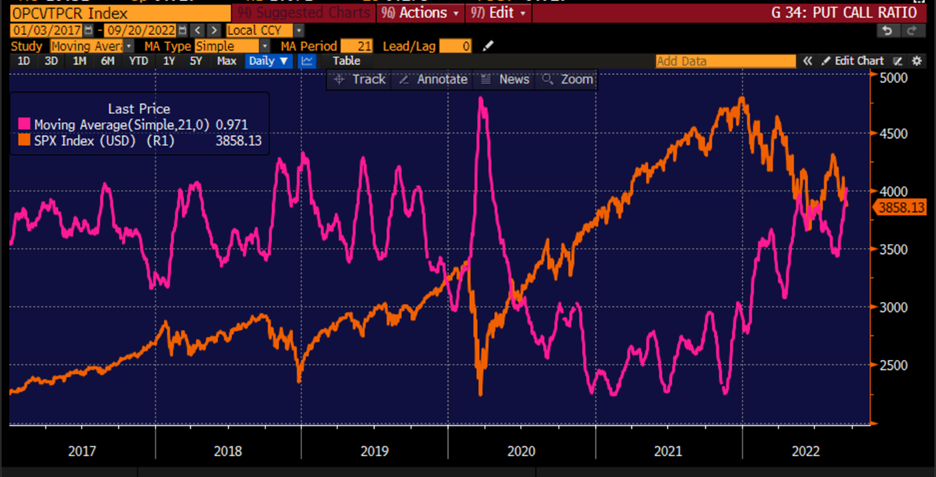
Source: Bloomberg
It is quite clear that the moving average is now at levels that prevailed during the three years prior to 2020.
It is relevant to decide whether this can be used as a reliable indicator, contrarian or not. The answer has to be no better than “maybe”. We see various instances of peaks in the ratio coinciding with buying opportunities, and vice versa, but several other false positives and negatives.
Finally, let’s take a close look at mid-2017 to mid-2019. Remember that late 2018 was the last time prior to now that the Fed was simultaneously raising rates while shrinking its balance sheet:
21-day Moving Average (magenta) of All Exchange Put/Call Ratio (OPCVTPCR), with S&P 500 Index (orange), July 2017 – June 2019
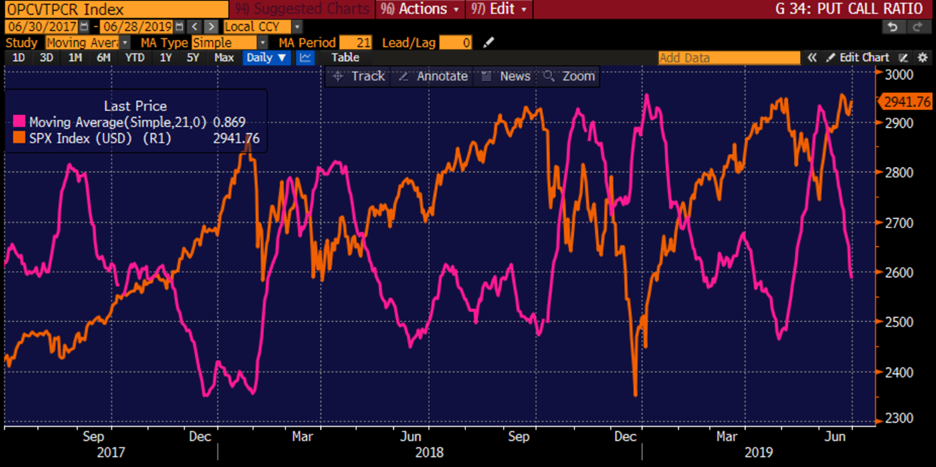
Source: Bloomberg
The ratio was an extraordinary contrary indicator prior to “Volmageddon” – the sharp drop in stocks and blow-up in volatility that occurred in February 2018. Yet it failed miserably in October of that year, the time that might be the closest parallel to our own. We see the ratio spike at that time, only to abate just as SPX plunged in December. We then see it spike again just as the selloff was ending and stock prices began a substantial bounce.
As Meat Loaf might say, “Two Out of Three Ain’t Bad”. The problem is that the drawdown that one might have suffered enough portfolio damage in late ’18 that they would have missed the 2019 rally. And again, we were in the midst of a series of rate hikes and QT in late 2018 – sound familiar?
The put/call ratio can be a very useful tool – one that I consult often. But its messages are far from foolproof, and its false messages can be costly. Use with care.
[i] Full disclosure: I am on the board of one of those 16 exchanges – MIAX Pearl
Disclosure: Interactive Brokers
The analysis in this material is provided for information only and is not and should not be construed as an offer to sell or the solicitation of an offer to buy any security. To the extent that this material discusses general market activity, industry or sector trends or other broad-based economic or political conditions, it should not be construed as research or investment advice. To the extent that it includes references to specific securities, commodities, currencies, or other instruments, those references do not constitute a recommendation by IBKR to buy, sell or hold such investments. This material does not and is not intended to take into account the particular financial conditions, investment objectives or requirements of individual customers. Before acting on this material, you should consider whether it is suitable for your particular circumstances and, as necessary, seek professional advice.
The views and opinions expressed herein are those of the author and do not necessarily reflect the views of Interactive Brokers, its affiliates, or its employees.
Disclosure: Options Trading
Options involve risk and are not suitable for all investors. Multiple leg strategies, including spreads, will incur multiple commission charges. For more information read the "Characteristics and Risks of Standardized Options" also known as the options disclosure document (ODD) or visit ibkr.com/occ


