


Much has been made of the recent decline in the CBOE Volatility Index (VIX). In just two weeks, we have seen VIX fall from around 20 to just over 17. That is a significant change in a short period of time, and many have viewed that as a sign of a more sanguine market. That perception is generally correct, but the VIX futures traders appear less convinced that volatility has been truly vanquished.
Please bear in mind my ongoing warning: VIX is not explicitly the market’s fear gauge. Yes, VIX tends to rise during market declines and ahead of major news events, but that is only a reflection of traders’ demand for hedging protection and speculation. Over the past year, speculative demand for options has played an increasing role in the pricing calculation. We need only to look at the past week for an example of this phenomenon. On Monday, VIX rose 3.35% on a day when the underlying S&P 500 Index (SPX) rose 1.44% in the aftermath of an economic release that cleared up the market’s labor market concerns.
Bearing in mind that VIX is calculated from a wide range of SPX options with an average of 1 month until expiry, we need to understand that VIX was historically boosted above at-money implied SPX volatility by out of the money puts and suppressed by out of the money calls. With the recent wave of call options speculation, those calls no longer suppress VIX to the degree they used to, and can in fact boost VIX when speculators are active. That explains the recent phenomenon, which we saw on Monday, of VIX rising on up days for SPX.
We can better understand this relationship using a graph of options skew. The graph below shows the current skew of one-month SPX options (white) versus one month ago (green). The lower portion shows the absolute changes in implied volatilities at different delta levels for the options.
Skew of 1 Month SPX Options, Today (white) vs 1 Month Ago (green) and Differences (bottom)
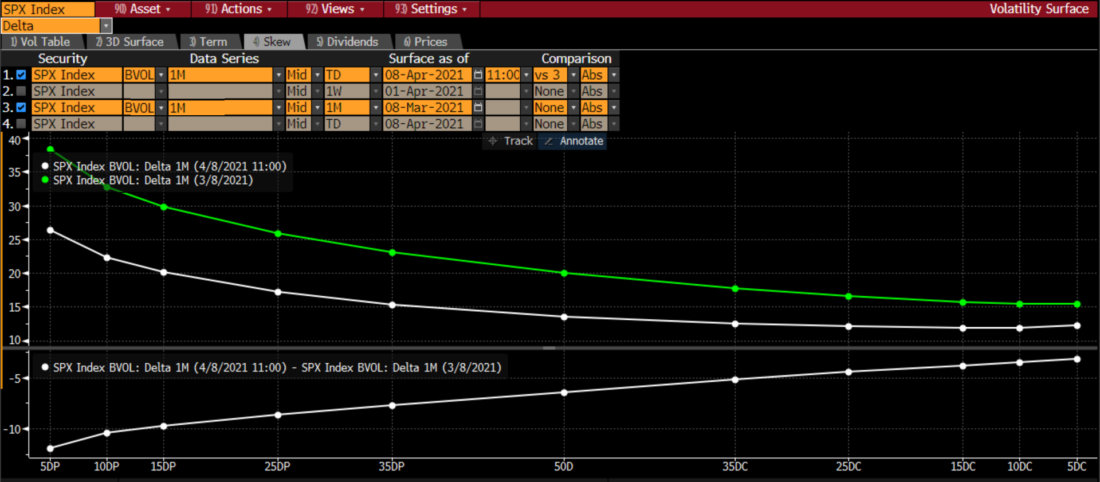
Source: Bloomberg
We can see that much of the decline came in below market options. Those of course are used by traders seeking protection from a down move in the market. Above market implied volatilities remained quite firm. It should not be surprising that traders would be more concerned about gains than losses as the index trades at record highs. We see a sanguine market right now. Does that persist into the future?
The VIX futures curve says no. We see VIX futures continue to trade well above spot VIX. A quick glance at the VIX futures curve shows this to be the case, though to be fair, it has done so for some time:
VIX Futures Curves at Various Time Periods (see legend)
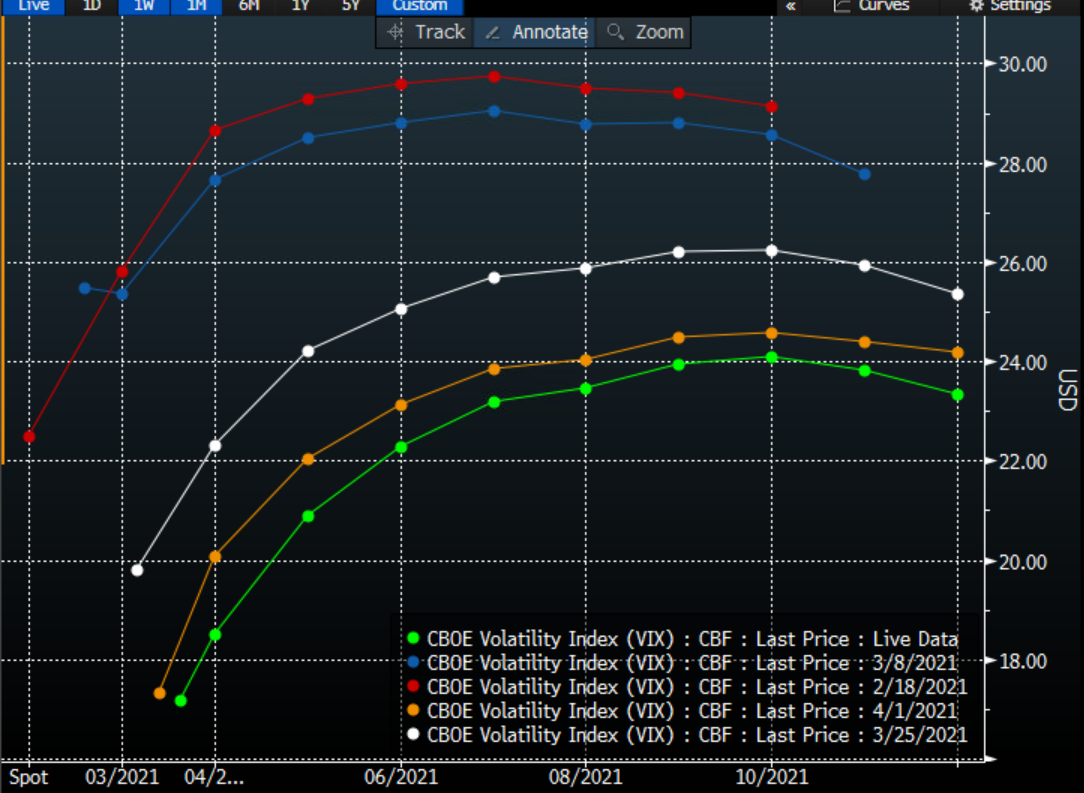
Source: Bloomberg
A key difference is the timing of the bump. When we look at the curves from about 6 weeks ago (red) and 1 month ago (blue), we see that the curve slopes upward sharply in the first two months. At the time we attributed that bump to potential tax deadline fears and concerns that the stimulus bill could be a “buy the rumor, sell the news” event. Since then, the stimulus package was well-received and the tax deadline was pushed back until May. We now see the futures peaking in late summer. In a recent Bloomberg article, I attributed that timing to some contribution of fears about seasonal worries that tend to materialize around September, which could be brought into focus when the proposed infrastructure bill is likely to be debated:
“It is not unrealistic to think that there are some who are hedging the idea that some modest selling could spiral into something more meaningful in late summer/early fall…Until this summer, the infrastructure bill and any associated tax increases are mostly theoretical. That debate is likely to heat up and become something potentially tangible this summer.”
That said, the futures curves above show that traders were expecting even higher volatility for the late summer/early fall period than they are now. Yet if markets indeed climb a wall of worry, we need to consider what happens now that fewer traders appear to be worried enough to be bidding for out of the money puts.
Disclosure: Interactive Brokers
The analysis in this material is provided for information only and is not and should not be construed as an offer to sell or the solicitation of an offer to buy any security. To the extent that this material discusses general market activity, industry or sector trends or other broad-based economic or political conditions, it should not be construed as research or investment advice. To the extent that it includes references to specific securities, commodities, currencies, or other instruments, those references do not constitute a recommendation by IBKR to buy, sell or hold such investments. This material does not and is not intended to take into account the particular financial conditions, investment objectives or requirements of individual customers. Before acting on this material, you should consider whether it is suitable for your particular circumstances and, as necessary, seek professional advice.
The views and opinions expressed herein are those of the author and do not necessarily reflect the views of Interactive Brokers, its affiliates, or its employees.
Disclosure: Options Trading
Options involve risk and are not suitable for all investors. Multiple leg strategies, including spreads, will incur multiple commission charges. For more information read the "Characteristics and Risks of Standardized Options" also known as the options disclosure document (ODD) or visit ibkr.com/occ
Disclosure: Futures Trading
Futures are not suitable for all investors. The amount you may lose may be greater than your initial investment. Before trading futures, please read the CFTC Risk Disclosure. A copy and additional information are available at ibkr.com.


