


MSFT Upcoming Earnings and Option Straddle Price
As we approach Microsoft’s earnings release on April 25, 2024, after the market closes, the trading community is observing the options market for clues about expected stock movements. With just one day left, the current options straddle implies a move of 4.4% in either direction. But how does this compare to historical movements and previous straddles? Let’s examine the historical data.
Microsoft’s Historical Pre-Earnings Straddle
Source: Market Chameleon
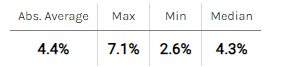
Historically, the average value of Microsoft’s pre-earnings straddle at the market close, just before earnings, has been around 4.4% of the spot price. This aligns precisely with the current straddle price, suggesting a normal market expectation as we head into the earnings announcement. Looking specifically at third-quarter earnings, the average historical straddle price has been slightly lower at 4.2%.
Historical MSFT Pre-Earnings Option Straddle Price
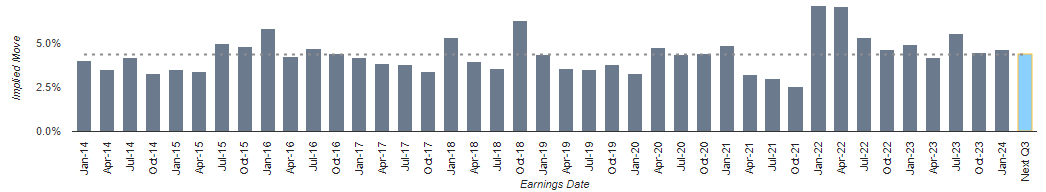
The historical range for these straddles has been quite broad, stretching from 7.1% to 2.6%. This high variance indicates that while the current straddle is priced at its average, there’s historically been significant fluctuation in how much the market expects the stock to move.
Historical Stock Movements on Earnings Days
Source: Market Chameleon
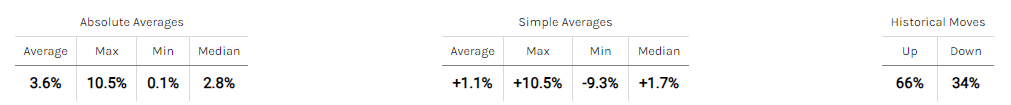
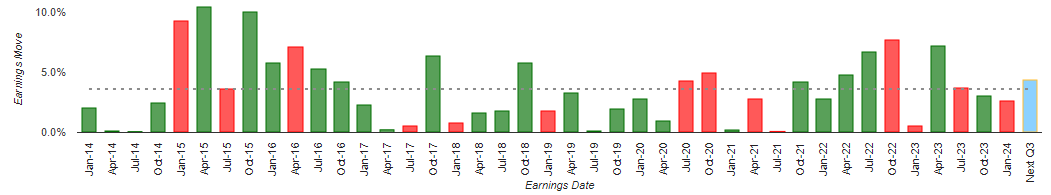
On average, Microsoft’s stock has moved either up or down by about 3.6% to 3.9% during Q3 earnings days. This suggests that the option straddles have slightly overestimated the potential movements, which could be an important consideration for traders thinking about entering a straddle position now.
Historical MSFT Earnings Stock Movement
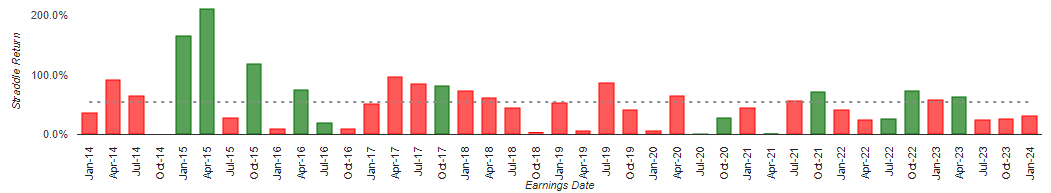
Performance of the Earnings Straddle
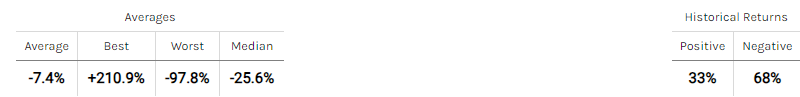
Source: Market Chameleon
Analyzing the one-day straddle performance over earnings reveals an average return of -7.4%, with a win rate of only 33%. This performance metric suggests that the market tends to overestimate Microsoft’s actual earnings day movements. Notably, Q3 earnings have shown slightly positive returns on occasion, influenced by a significant outlier move in 2015. Without such outliers, the general trend indicates more muted actual stock movements compared to the expectations set by option premiums.
Historical MSFT Earnings Option Straddle Performance
Conclusion
The current pricing of Microsoft’s earnings straddle seems attractive, as it is aligned with historical averages, with a full day of trading ahead suggesting minimal potential decay in value. However, history shows that holding a long straddle into the day after earnings might not be the most lucrative strategy, given that actual stock movements have generally been less volatile than the premiums implied.
Investors and traders should weigh these factors carefully. The historical data presents a case where the straddle tends to overestimate movement, which might caution against expecting large earnings-related price swings. As always, market conditions can change, and past performance is not always indicative of future results. Stay tuned, and trade wisely.
—
Originally Posted April 24, 2024 – Microsoft (MSFT) Pre-Earnings Straddle and Historical Moves
NOTE: Stock and option trading involves risk that may not be suitable for all investors. Examples contained within this report are simulated And may have limitations. Average returns and occurrences are calculated from snapshots of market mid-point prices And were Not actually executed, so they do not reflect actual trades, fees, or execution costs. This report is for informational purposes only, and is not intended to be a recommendation to buy or sell any security. Neither Market Chameleon nor any other party makes warranties regarding results from its usage. Past performance does not guarantee future results. Please consult a financial advisor before executing any trades. You can read more about option risks and characteristics at theocc.com.
Disclosure: Market Chameleon
The information provided on MarketChameleon is for educational and informational purposes only. It should not be considered as financial or investment advice. Trading and investing in financial markets involve risks, and individuals should carefully consider their own financial situation and consult with a professional advisor before making any investment decisions. MarketChameleon does not guarantee the accuracy, completeness, or reliability of the information provided, and users acknowledge that any reliance on such information is at their own risk. MarketChameleon is not responsible for any losses or damages resulting from the use of the platform or the information provided therein. The 7-day free trial is offered for evaluation purposes only, and users are under no obligation to continue using the service after the trial period.
Disclosure: Interactive Brokers
Information posted on IBKR Campus that is provided by third-parties does NOT constitute a recommendation that you should contract for the services of that third party. Third-party participants who contribute to IBKR Campus are independent of Interactive Brokers and Interactive Brokers does not make any representations or warranties concerning the services offered, their past or future performance, or the accuracy of the information provided by the third party. Past performance is no guarantee of future results.
This material is from Market Chameleon and is being posted with its permission. The views expressed in this material are solely those of the author and/or Market Chameleon and Interactive Brokers is not endorsing or recommending any investment or trading discussed in the material. This material is not and should not be construed as an offer to buy or sell any security. It should not be construed as research or investment advice or a recommendation to buy, sell or hold any security or commodity. This material does not and is not intended to take into account the particular financial conditions, investment objectives or requirements of individual customers. Before acting on this material, you should consider whether it is suitable for your particular circumstances and, as necessary, seek professional advice.
Disclosure: Options Trading
Options involve risk and are not suitable for all investors. Multiple leg strategies, including spreads, will incur multiple commission charges. For more information read the "Characteristics and Risks of Standardized Options" also known as the options disclosure document (ODD) or visit ibkr.com/occ
Disclosure: Options (with multiple legs)
Options involve risk and are not suitable for all investors. For information on the uses and risks of options, you can obtain a copy of the Options Clearing Corporation risk disclosure document titled Characteristics and Risks of Standardized Options by clicking the link below. Multiple leg strategies, including spreads, will incur multiple transaction costs. "Characteristics and Risks of Standardized Options"


Join The Conversation
If you have a general question, it may already be covered in our FAQs. If you have an account-specific question or concern, please reach out to Client Services.