


Last month’s expiration was a wild one. Markets had been taking most expirations in stride, but last month’s was a so-called “triple-witch”: a quarterly occurrence when equity and ETF options expire alongside index futures and futures options. During the lead up to that date we saw a bout of volatility. In hindsight it was yet another short-term opportunity for traders to “buy the dip”, though I received nervous calls during those days. Since markets tend to have short memories, here is a reminder:
5 Day Tick Chart for June 16th – 22nd, 2021 – S&P 500 (SPX, white, right scale) and NASDAQ 100 (NDX, blue, left scale)
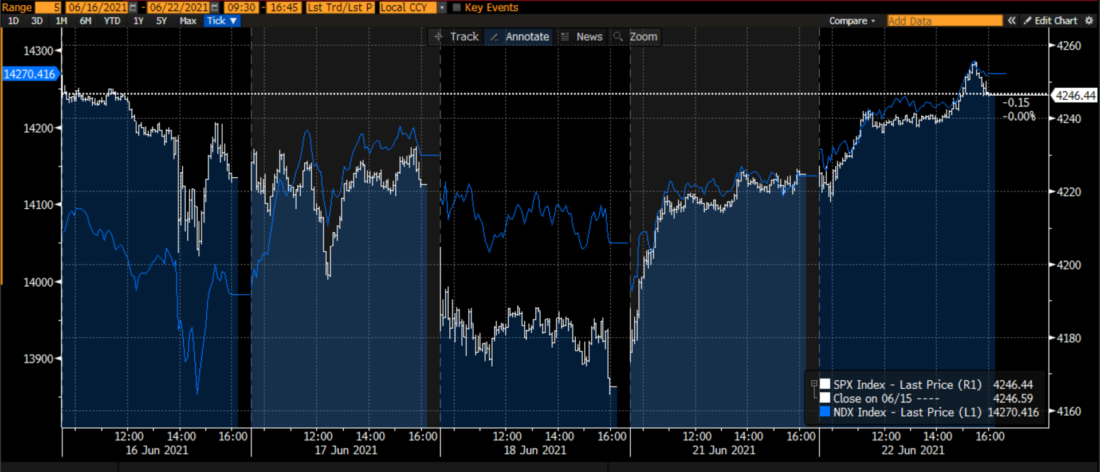
Source: Bloomberg
We see that NDX led the declines on Wednesday of that week, while SPX followed suit on Friday even as NDX recovered somewhat. An FOMC meeting on Wednesday and some intemperate comments by a Fed governor on Friday morning just ahead of the AM expiration of futures and futures options spurred the activity. By the following Tuesday, when other Fed governors made more positive comments, all seemed to be forgotten, as both indices recouped their losses.
As I write this, we are in the midst of the second day of Federal Reserve Chair Powell’s testimony before Congress. Mr. Powell speaks carefully and stays on message meaning that even some eye-popping CPI and PPI numbers were largely taken in stride. I offered the following comment to a publication yesterday: “The data-dependent Fed told us that for today at least we shouldn’t worry about the data”. As a result, while we have had some market gyration this week, the moves have been muted, as seen below:
4 Day Tick Chart for July 12th – 15th, 2021 – S&P 500 (SPX, white, right scale) and NASDAQ 100 (NDX, blue, left scale)

Source: Bloomberg
It would be reasonable for one to expect that a regular monthly expiration would be far less significant than a quarterly expiration. After all, there are 8 of them each year as opposed to 4 quarterly expirations, and there are fewer financial products disappearing. One could also argue that there is little to differentiate the monthly expirations from the weekly expirations that occur on the other 40 weeks, since the most actively traded options all have weekly (or even thrice-weekly) expirations. Yet the open interest in equity and ETF options is roughly on par with levels that we saw ahead of last month’s expiry: over 427 million contracts yesterday versus 450 million on June 17th. That means that going into tomorrow’s trading we still need to pay very close attention to contracts that are at or near strikes ahead of the close.
It is too early to get a real read on those strikes – I don’t propose to know where key equities and ETFs will be trading in an hour, let alone at 3 PM (Eastern) tomorrow. But it is not too early for anyone to be trading options to scour their holdings for near-money strikes with high volume and/or open interest. Those strikes have an uncanny way of becoming either magnets or accelerators as the underlying items approach the key levels, and it is never too early for people to be looking for those opportunities or pitfalls ahead of expiration.
Disclosure: Interactive Brokers
The analysis in this material is provided for information only and is not and should not be construed as an offer to sell or the solicitation of an offer to buy any security. To the extent that this material discusses general market activity, industry or sector trends or other broad-based economic or political conditions, it should not be construed as research or investment advice. To the extent that it includes references to specific securities, commodities, currencies, or other instruments, those references do not constitute a recommendation by IBKR to buy, sell or hold such investments. This material does not and is not intended to take into account the particular financial conditions, investment objectives or requirements of individual customers. Before acting on this material, you should consider whether it is suitable for your particular circumstances and, as necessary, seek professional advice.
The views and opinions expressed herein are those of the author and do not necessarily reflect the views of Interactive Brokers, its affiliates, or its employees.
Disclosure: Options Trading
Options involve risk and are not suitable for all investors. Multiple leg strategies, including spreads, will incur multiple commission charges. For more information read the "Characteristics and Risks of Standardized Options" also known as the options disclosure document (ODD) or visit ibkr.com/occ
Disclosure: Futures Trading
Futures are not suitable for all investors. The amount you may lose may be greater than your initial investment. Before trading futures, please read the CFTC Risk Disclosure. A copy and additional information are available at ibkr.com.


