

")


This afternoon promises to be an important one for tech investors, with both Microsoft (MSFT) and Tesla (TSLA) schedule to release quarterly results after the market’s close. While analysts’ estimates provide an important framework for decision making around an earnings release, options markets offer a subtle view into the market’s expectations about potential moves. Fortunately, your TWS allows you clarity into the options market’s views.
The immense size of MSFT gives it the second highest weighting (only Apple is larger) in indices that are weighted by market capitalization. Those include the NASDAQ 100 (NDX) and S&P 500 (SPX) indices, where MSFT comprises about 11% and 6% of the index weight respectively. An outsize move in MSFT would necessarily spill into moves in those key indices.
While TSLA represents “only” about 2.5% of NDX, its mindshare among all types of investors as a bellwether for speculative behavior is enormous. Its lack of representation in SPX makes this a particularly critical release for TSLA. A positive result today could give the company the fourth consecutive quarter of profitability that is typically required for entry into the S&P 500 Index. Analyst consensus has steadily risen from a $2 loss to a 2 cent loss, fueling a doubling of the stock price throughout the past few months. Addition into SPX would likely bring a wave of buying from passive investors and ETF’s like SPY.
The simplest way to see the option market’s anticipated move is to look at the nearest term, at-money straddle. Here is a recent snapshot for MSFT:
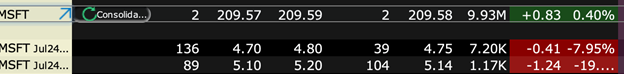
Although the strikes were cut off in this picture, I have displayed the weekly 210 strike calls and puts that expire on Friday. The midpoint of those options, less any intrinsic value, is a quick guide to the implied move of the stock. In this case, that is $9.48 (4.75 + 5.15 – (210 – 209.58)), or about 4.5% (9.48 / 209.58). Another way to do that is to take the average of the implied volatilities, which are displayed in annualized terms, and convert them to daily volatilities by dividing by 16. You will see that those numbers generally agree if the options are very short-lived. (For a more detailed explanation of the “Rule of 16”, please read this link).
This technique becomes more difficult for a stock like TSLA, which can move around too quickly for hand calculation. This is where the more sophisticated analytical tools become extraordinarily helpful. Note the following examples for MSFT and TSLA, which were created using the Multi-Expiry skew tool (Analytical Tools -> Options Analysis -> Volatility Skew -> Multi-Expiry Skew). I clicked on the “+” button to bring up the next two weekly expirations (July 24th and 31st) and the next monthly expiration (August 21st)
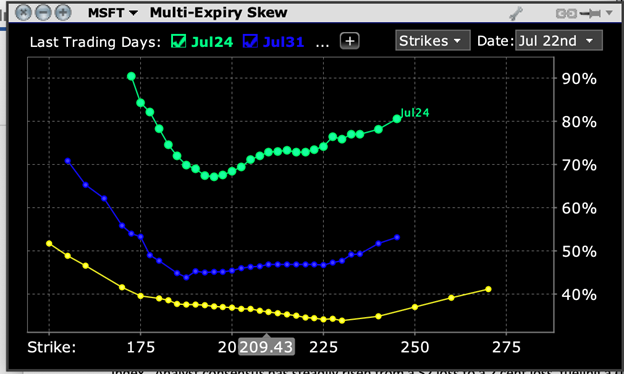
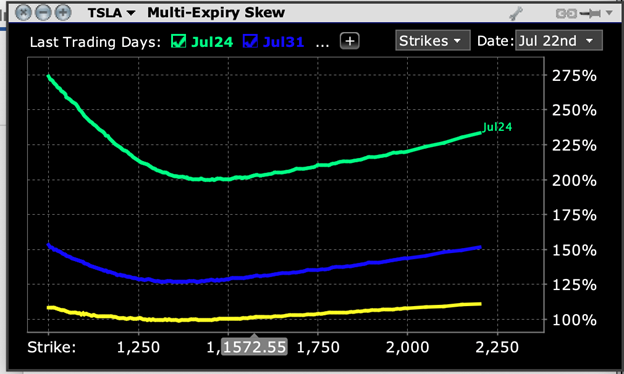
Options traders often refer to graphs of this nature as “smiles”, because the tendency is for near money options to have lower implied volatilities than their out of the money counterparts. The smile is usually lopsided, because traders tend to fear downside rather than upside, though you should notice that the yellow line for TSLA (the legend for August 21 expiry was cut off) shows a relatively symmetrical, if not somewhat upside biased skew.
We can see that in the short-term, traders are particularly fearful of downside moves after earnings, especially so in the case of MSFT where the weekly out of the money puts have an implied volatility about 20% higher than those of the at money puts. Traders in TSLA, on the other hand, are showing concern about potential downside, but are not as biased this week or especially going out further.
Another helpful picture is shown by the Probability Lab (Analytical Tools -> Option Analytics -> Probability Lab). The static pictures that I display below don’t do justice to the capabilities of using it live, but the implied probabilities for the weekly options are telling nonetheless:
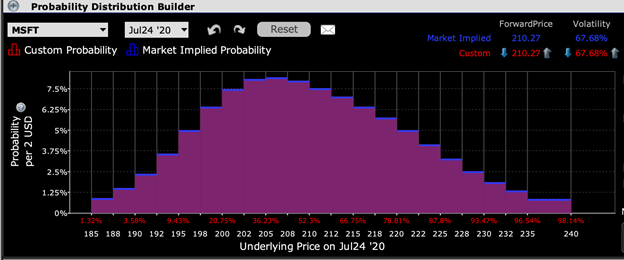
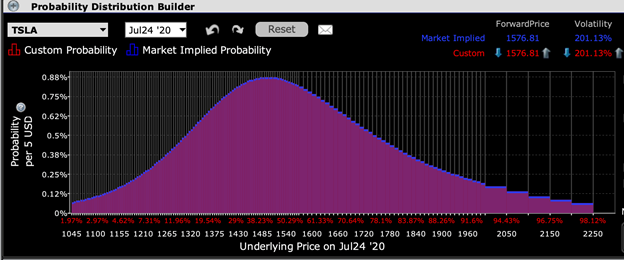
In each case, the option markets are implying peak probability for downside moves in both stocks. In the case of MSFT, that peak is in about 2.5% the current price, while in TSLA the peak is closer to a 5% downside. In both cases, however, the shape of the probability curves are quite similar.
There are many subtleties about trading and pricing options ahead of a company’s earnings release. Yet even a cursory understanding of the powerful tools available to users of the IB TWS will allow even relatively novice investors to garner a richer picture of their holdings as they head into the release of important corporate data.
Disclosure: Interactive Brokers
The analysis in this material is provided for information only and is not and should not be construed as an offer to sell or the solicitation of an offer to buy any security. To the extent that this material discusses general market activity, industry or sector trends or other broad-based economic or political conditions, it should not be construed as research or investment advice. To the extent that it includes references to specific securities, commodities, currencies, or other instruments, those references do not constitute a recommendation by IBKR to buy, sell or hold such investments. This material does not and is not intended to take into account the particular financial conditions, investment objectives or requirements of individual customers. Before acting on this material, you should consider whether it is suitable for your particular circumstances and, as necessary, seek professional advice.
The views and opinions expressed herein are those of the author and do not necessarily reflect the views of Interactive Brokers, its affiliates, or its employees.
Disclosure: Options Trading
Options involve risk and are not suitable for all investors. Multiple leg strategies, including spreads, will incur multiple commission charges. For more information read the "Characteristics and Risks of Standardized Options" also known as the options disclosure document (ODD) or visit ibkr.com/occ


