

")


During earnings season, investors become justifiably concerned with analysts’ expectations for a company’s earnings and revenues. While analysts’ estimates provide an important framework for decision making around an earnings release, options markets offer a subtle view into the market’s expectations about potential moves. Fortunately, your TWS allows you clarity into the options market’s views.
We will be using Microsoft (MSFT) for an example. The data used are from Wednesday, July 22, 2020, a few hours before the company’s earnings release after the markets closed. While the strikes and pricing are unique to that stock that day, the methodologies that we discuss can be applied almost universally.
Options markets signal the market’s expectation for the stock’s move after the earnings release. The simplest way to see that anticipated move is to look at the nearest term, at-money straddle. Here is a recent snapshot for MSFT:
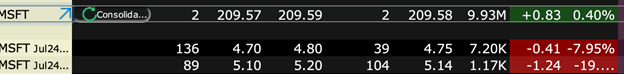
Although the strikes were cut off in this picture, I have displayed the weekly 210 strike calls and puts that expire on Friday, July 24th. The midpoint of those options, minus any intrinsic value, is a quick guide to the implied move of the stock. In this case, that is $9.48 (4.75 + 5.15 – (210 – 209.58)), or about 4.5% (9.48 / 209.58). Another way to do that is to take the average of the implied volatilities, which are displayed in annualized terms, and convert them to daily volatilities by dividing by 16. You will see that those numbers generally agree if the options are very short-lived. (For a more detailed explanation of the “Rule of 16”, please read this link).
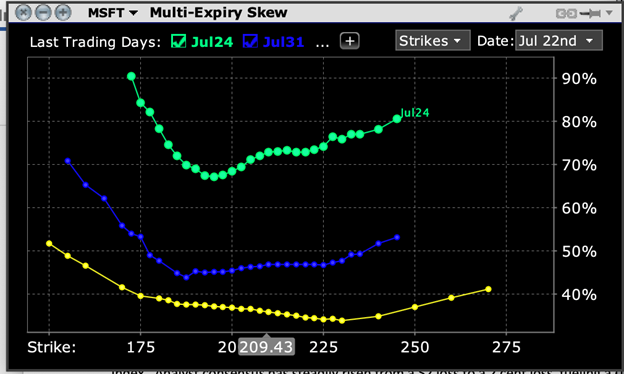
This technique has its shortcomings, though. For starters, it becomes difficult to do hand calculations if the stock moves around quickly. Also, utilizing the straddle in this manner ignores subtleties of time decay, especially if there are several days until the options expire. This is where the more sophisticated analytical tools of the TWS become extraordinarily helpful. Note the following example for MSFT which was created using the Multi-Expiry skew tool (Analytical Tools -> Options Analysis -> Volatility Skew -> Multi-Expiry Skew). I typically find it most useful to look at the nearest expirations with significant volume, so I clicked on the “+” button to bring up the next two weekly expirations (July 24th and 31st) and the next monthly expiration (August 21st).
Options traders often refer to graphs of this nature as “smiles”, because the tendency is for near money options to have lower implied volatilities than their out of the money counterparts. The smile is usually lopsided, because traders tend to fear downside rather than upside, and because there are more natural writers of out of the money call options (particularly covered calls) than there are of out of the money puts. We can see that in the short-term, traders are particularly fearful of a downside move in MSFT after earnings, where the weekly out of the money puts have an implied volatility about 20% higher than those of the at money puts.
Another helpful picture is shown by the Probability Lab (Analytical Tools -> Option Analytics -> Probability Lab). The static pictures that I display below don’t do justice to the capabilities of using it live, but the implied probabilities for the weekly options are telling nonetheless:
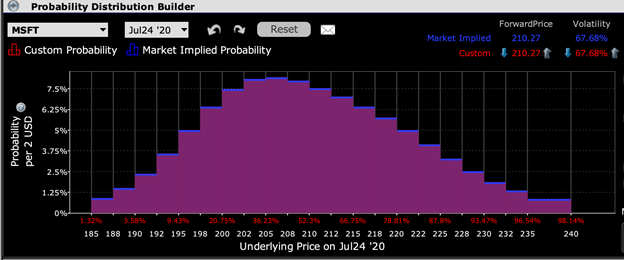
In this view, the option markets are implying peak probability is for a downside move to about 205, which was about 2.5% below MSFT’s then current price of $210. The curve is also more steeply sloped to the downside, which makes sense alongside the steep downside skew that we saw in the implied volatility curve above. As it turned out, MSFT closed at 202.54 on July 23rd, the day after earnings. That was the 2nd highest probability displayed in the graph above.
There are many subtleties about trading and pricing options ahead of a company’s earnings release. Yet even a cursory understanding of the powerful tools available to users of the IB TWS will allow even relatively novice investors to garner a richer picture of their holdings as they head into the release of important corporate data.
Disclosure: Interactive Brokers
The analysis in this material is provided for information only and is not and should not be construed as an offer to sell or the solicitation of an offer to buy any security. To the extent that this material discusses general market activity, industry or sector trends or other broad-based economic or political conditions, it should not be construed as research or investment advice. To the extent that it includes references to specific securities, commodities, currencies, or other instruments, those references do not constitute a recommendation by IBKR to buy, sell or hold such investments. This material does not and is not intended to take into account the particular financial conditions, investment objectives or requirements of individual customers. Before acting on this material, you should consider whether it is suitable for your particular circumstances and, as necessary, seek professional advice.
The views and opinions expressed herein are those of the author and do not necessarily reflect the views of Interactive Brokers, its affiliates, or its employees.
Disclosure: Options Trading
Options involve risk and are not suitable for all investors. Multiple leg strategies, including spreads, will incur multiple commission charges. For more information read the "Characteristics and Risks of Standardized Options" also known as the options disclosure document (ODD) or visit ibkr.com/occ


