


Use the Securities Lending Dashboard to analyze short sale metrics for these and other stocks.
Securities lending activity in 2022 has been eventful. While meme stocks, SPACs and corporate events drove securities lending headlines in 2021, they have now been joined by global uncertainty in the form of conflict, wide-spread inflation and supply-chain shortages. The added volatility in the markets has expanded focus beyond the usual top earners in securities lending to all asset classes and regions. Using our buy-side data platform, Orbisa, we compare key differences over the first five months of 2022 and 2021 to identify a few emerging buy-side data trends that may shape the rest of the year.
HOT ETFS ACROSS THE GLOBE
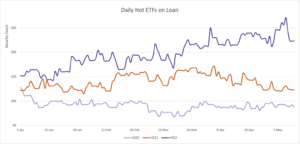
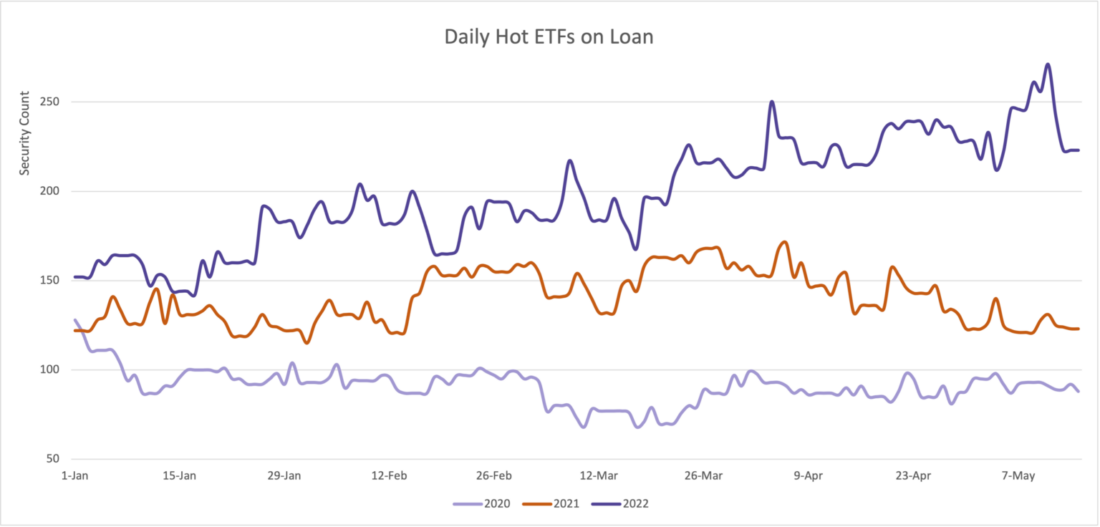
2021 and 2022 have been banner years for ETF activity, with high-yield corporate bond ETF, HYG, frequently appearing in DataLend’s monthly revenue recaps. Globally, many more ETFs have traded special (averaging over 400 bps fee) in 2022 year to date—778 in total—compared to just 582 and 403 in 2021 and 2020, respectively. The below figure shows the daily number of ETFs trading special for the last three years. As we can see, 2022 has outpaced 2020 and 2021, and the gap continued to widen in May.
CORPORATE DEBT DEMAND ON THE RISE
No other asset class has experienced as much year-over-year percentage growth in lending revenue as corporate debt. Demand has steadily been on the rise for corporate bonds over the last two years, and 2022 has seen a dramatic increase in both utilization and borrowing costs.
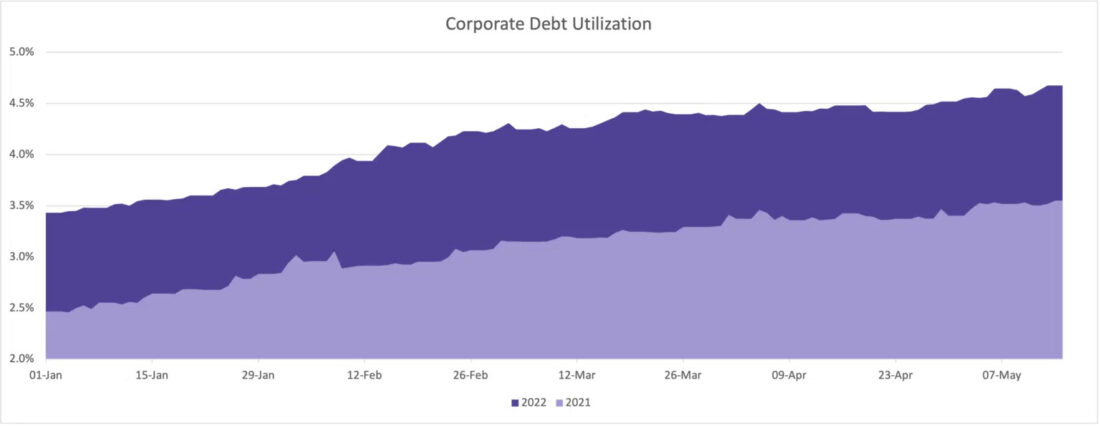
The number of bonds with a utilization greater than 50% in 2022 is 1,299, up from 674 in 2021. Similarly, the number of bonds trading at non-GC levels (fees greater than 50 bps) is up from 741 in 2021 to 1,992 in 2022. As an asset class, corporate debt utilization continues to rise. In the below figure, we can see that utilization in early 2021 ranged from 2.5% to 3.6%, while over the same period in 2022 utilization ranged from 3.4% to 4.7%.
SPECIALS COUNT UP IN ASIA PACIFIC
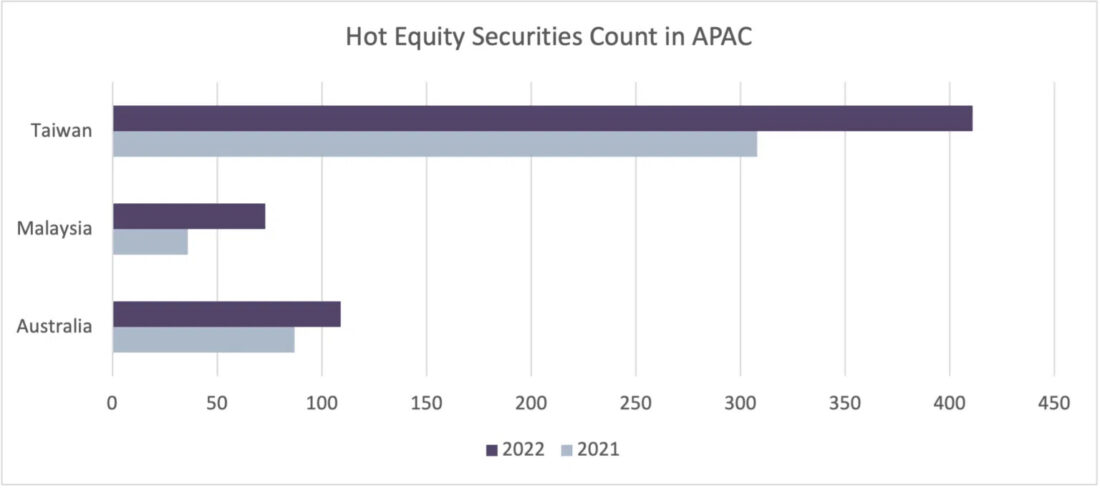
Over the past year, the number of equities that traded special (400 bps fee and above) increased by 6% globally. Several key markets in APAC significantly outpaced the average. Taiwan has 411 equities with a daily fee greater than 400 bps in 2022 compared to 302 over the same period in 2021. In Malaysia, 73 equities have traded special in 2022 compared to 36 the year prior. The Australian market also saw a noticeable increase from 87 equities in 2021 to 109 in 2022.
2022 thus far has expanded the scope of specials within the global securities lending market. As we enter the second half of the year, Orbisa will continue to track and uncover the latest trends in the industry.
—
Originally Posted – EMERGING TRENDS IN BUY-SIDE DATA
Disclosure: Orbisa
ORBISA (the “Firm”) is not registered as an investment advisor or otherwise in any capacity with any securities regulatory authority. The information contained, referenced or linked to herein is proprietary and exclusive to the Firm, does not constitute investment or trading advice, is provided for general information and discussion purposes only and may not be copied or redistributed without the Firm’s prior written consent. The Firm assumes no responsibility or liability for the unauthorized use of any information contained, referenced or linked to herein. © 2023 EquiLend Holdings LLC. All rights reserved.
Disclosure: Interactive Brokers
Information posted on IBKR Campus that is provided by third-parties does NOT constitute a recommendation that you should contract for the services of that third party. Third-party participants who contribute to IBKR Campus are independent of Interactive Brokers and Interactive Brokers does not make any representations or warranties concerning the services offered, their past or future performance, or the accuracy of the information provided by the third party. Past performance is no guarantee of future results.
This material is from Orbisa and is being posted with its permission. The views expressed in this material are solely those of the author and/or Orbisa and Interactive Brokers is not endorsing or recommending any investment or trading discussed in the material. This material is not and should not be construed as an offer to buy or sell any security. It should not be construed as research or investment advice or a recommendation to buy, sell or hold any security or commodity. This material does not and is not intended to take into account the particular financial conditions, investment objectives or requirements of individual customers. Before acting on this material, you should consider whether it is suitable for your particular circumstances and, as necessary, seek professional advice.
Disclosure: ETFs
Any discussion or mention of an ETF is not to be construed as recommendation, promotion or solicitation. All investors should review and consider associated investment risks, charges and expenses of the investment company or fund prior to investing. Before acting on this material, you should consider whether it is suitable for your particular circumstances and, as necessary, seek professional advice.


Join The Conversation
If you have a general question, it may already be covered in our FAQs. If you have an account-specific question or concern, please reach out to Client Services.