


In yesterday’s piece we noted the widening divergence between the NASDAQ Composite (COMP) and NASDAQ 100 Indices (NDX). The two indices tend to correlate quite highly – the R-squared tends to be between 0.97 and 0.985 – but the more tightly focused NDX has been outpacing the broader COMP for years. The outperformance of NDX has pushed the spread between the indices to their widest ever, as evidenced by the chart below:
5-Year Line Chart, NDX (blue) vs. COMP (white)
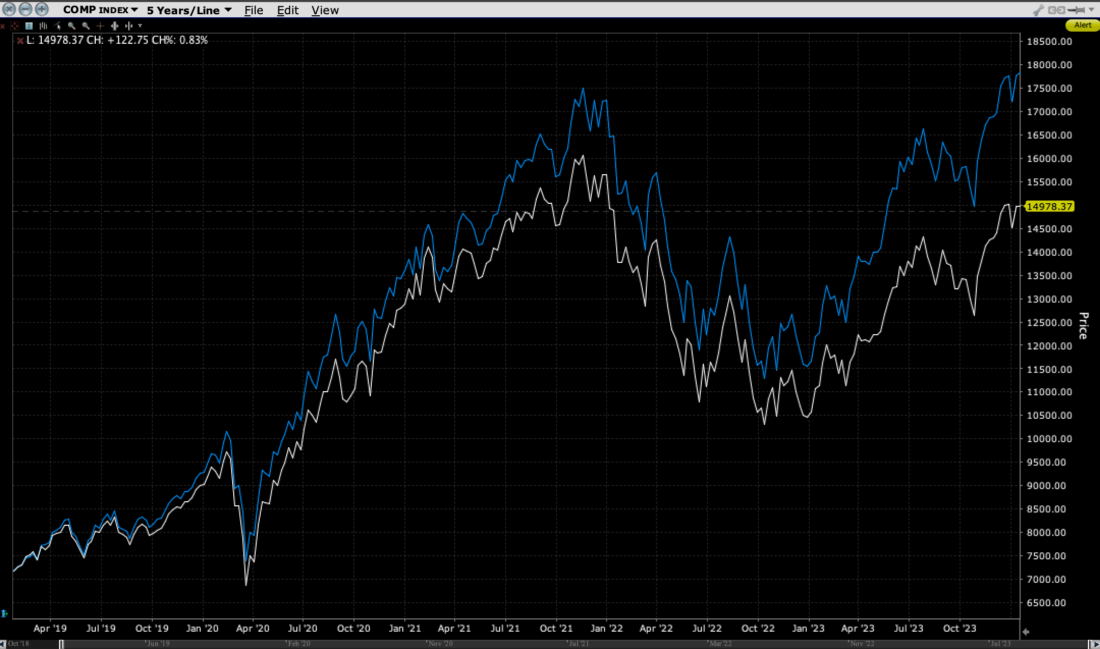
Source: Interactive Brokers
The outperformance of NDX is easy to explain. That market-capitalization index is dominated by megacap technology stocks like Apple (AAPL), Microsoft (MSFT) and Nvidia (NVDA). It’s been clear to everyone that those stocks have been the dominant leaders driving popular indices higher. The theme of yesterday’s piece highlighted how NVDA has been driving intraday movements in NDX and the S&P 500 (SPX). Today is no exception, with NVDA and other semiconductor stocks benefitting from solid earnings at Taiwan Semiconductor (TSM). They, along with AAPL, are allowing NDX to rise just under 1% at midday while the broader SPX is up only 0.25%.
But we also cautioned against being too eager to enter into trades that assume that the gap between NDX and COMP will fully close. A close examination of the chart above shows that the relative outperformance of NDX was evident in 1999-2000, yet the gap didn’t fully close when markets collapsed in March 2000. The same can be said for the 2021-2022 period. Major tech stocks led the 2021 advance, and while they actually fell more sharply in 2022, the gap never fully closed even then. As a result, if one is inclined to take the contrarian view that the largest tech stocks are due for a period of underperformance, don’t be greedy. The gap might narrow but not fully close.
Also mentioned yesterday was that Tuesday’s market showed how the largest tech stocks could paper over a broad market decline. We noted that on that day we saw NDX close -0.01% and COMP close -0.19% lower, even as decliners on that exchange outpaced advancers by a nearly 3:1 margin. This shows the power of the largest stocks. If they have a decent day, it can be enough to keep indices afloat.
A close look at the cumulative advance-decline line for the NDX component stocks versus the same statistic for the Nasdaq Exchange as a whole shows how the majority of stocks have been underperforming the more selective index. The total measure of advances-declines has been sinking steadily since the start of this year. Meanwhile, the specific advance-decline line for NDX has only been modestly lower. It is dipping vis-à-vis NDX, but it is too early to call that a significant divergence.
2-Year Lines: NDX (orange, top left X-axis), Total Cumulative NASDAQ Advances-Declines (green, top right X-axis), NDX Cumulative Advances-Declines (blue, bottom)
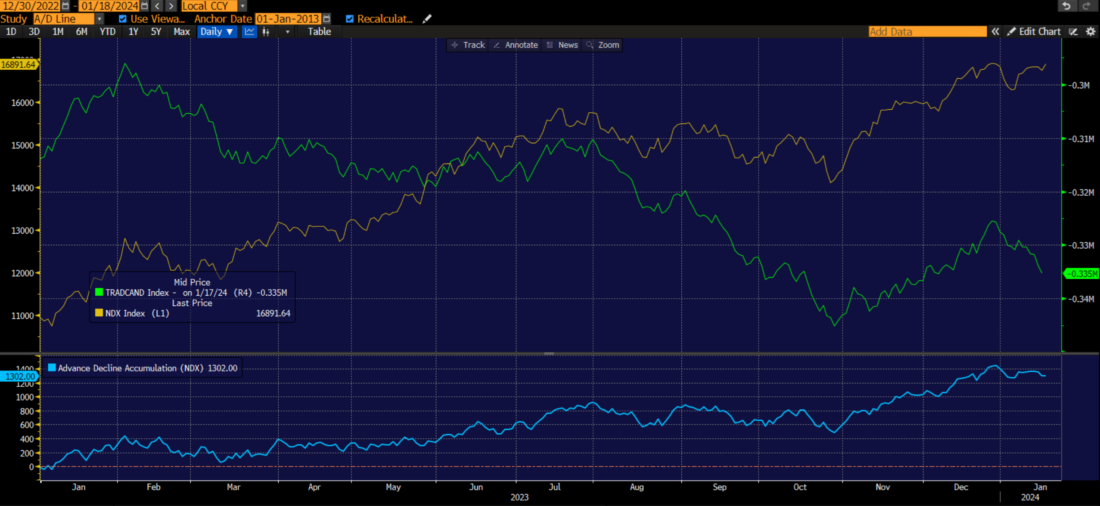
Source: Bloomberg
When we look at the same chart using SPX and NYSE trading data, the divergences exist, but are far less noticeable than for NASDAQ:
2-Year Lines: SPX (white, top), Total Cumulative NYSE Advances-Declines (red, top right X-axis), SPX Cumulative Advances-Declines (blue, bottom)
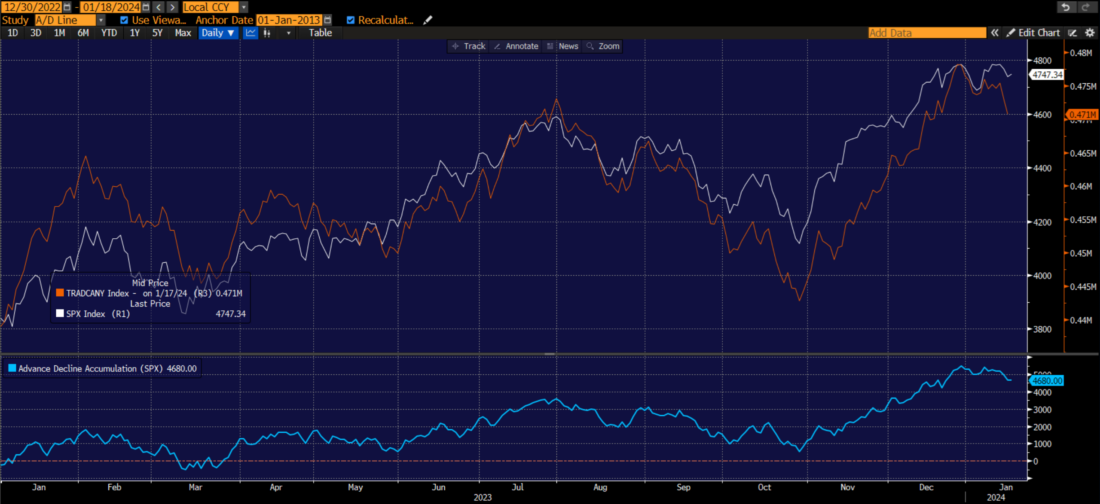
Source: Bloomberg
The summary here is that there may be some nascent signs of weakening market participation, but if the megacap tech stocks can continue to deliver, then popular indices could continue to perform decently. Much will depend on this earnings season. If those stocks can continue to deliver, then money will continue to flow into them. And if not, well….
Join The Conversation
If you have a general question, it may already be covered in our FAQs. If you have an account-specific question or concern, please reach out to Client Services.
Leave a Reply
Disclosure: Interactive Brokers
The analysis in this material is provided for information only and is not and should not be construed as an offer to sell or the solicitation of an offer to buy any security. To the extent that this material discusses general market activity, industry or sector trends or other broad-based economic or political conditions, it should not be construed as research or investment advice. To the extent that it includes references to specific securities, commodities, currencies, or other instruments, those references do not constitute a recommendation by IBKR to buy, sell or hold such investments. This material does not and is not intended to take into account the particular financial conditions, investment objectives or requirements of individual customers. Before acting on this material, you should consider whether it is suitable for your particular circumstances and, as necessary, seek professional advice.
The views and opinions expressed herein are those of the author and do not necessarily reflect the views of Interactive Brokers, its affiliates, or its employees.


Hello, I was wondering if you could possibly comment regarding the divergence of the IWM (Russell 2000 ETF) vs the SPY. WOW!!! What is going on here??? When the SPY peaked at $480 in 2021 the IWM was $240– exactly one half the value of the SPY! Now, the IWM, which for many, many years traded at about 50% the value of the SPY, is currently at $190—as if the SPY were trading at $380! This is the biggest divergence I have ever seen in more than 25 years following the financial markets. Why is this happening? Tech stock mania, and interest rates? There has got to be a reversion to the mean, either the SPY must come down, or the small cap IWM must rise. Or maybe they will both rise, with the IWM outperforming. This simply cannot continue. I feel strongly that they will “meet again.”
…Eventually.
I just wanted to clarify that the IWM actually peaked in Nov 2021 at $244, and the SPY peaked the first week of January 2022 at $480, so the IWM price was more than 50% of the SPY. “That was then,” as they say.
The QQQ/IWM divergence is even greater. I think Microsoft’s valuation alone is about equal to the entire Russell 2000! I still say NVDA will never have a 2 Trillion dollar valuation. It just seems incomprehensible to me.
Thanks
Thanks for engaging!
As of Friday’s close (Jan 19) the Russell 2000 is 1944; the S&P 500 is 4839.
I looked at the first week of January going back to year 2000 to compare them.
The Russell 2000 valuation is now 40% of the S&P 500. In 2002 and 2003 it was 43% of the S&P 500, which were the lowest percentage years I could find, so it is now an additional 3% lower than at ANY time in the past 21 years.
In January of 2014 the S&P 500 was 1842, the Russell 2000 was 1147— 62% of the S&P 500.
That was the highest ratio. It is now at the lowest.