


Following one of the most challenging years for equities in more than a decade, stocks have rebounded sharply in 2023 as investors have celebrated better-than-expected corporate earnings, resilient economic data, and decelerating inflation. In contrast to more cautious sentiment earlier in 2023, fears of a possible recession have been pushed out as investors have become more confident in the labor market’s durability and the economy’s ability to withstand higher interest rates.
The equities rally has been unevenly distributed in 2023.
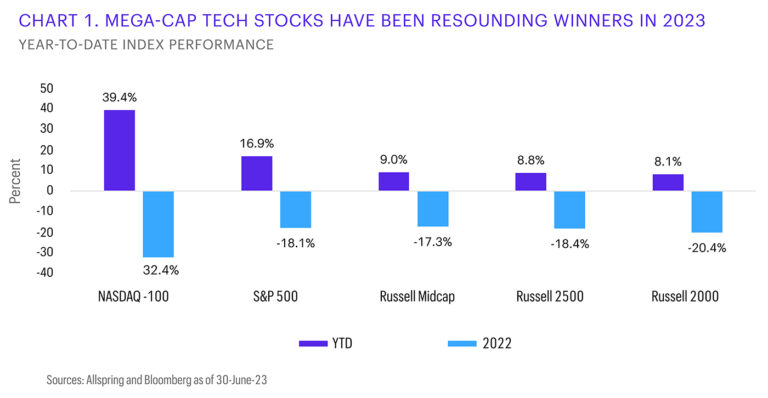
While all major equity indexes have risen this year, their returns have differed depending on market cap and style. Mega-cap technology stocks have been the resounding market leaders as the buzz around artificial intelligence (AI) has helped the Nasdaq 100 Index post its strongest first half in 40 years. On the other end of the spectrum, the Russell 2000® Index, which has a notable allocation to floundering small-cap regional banks, has underperformed the tech-heavy mega-cap Nasdaq 100 Index by its largest margin on record over the same period.
The largest seven stocks by market cap (Nvidia Corp.; Tesla, Inc.; Meta Platforms, Inc.; Apple Inc.; Amazon.com; Microsoft Corp.; and Alphabet Inc.)—now colloquially known as the “magnificent 7”—have added a stupefying $4.1 trillion in market value this year. This market-cap total is greater than the combined size of the bottom 240 stocks in the S&P 500 Index. Perhaps even more astonishing, Apple and Microsoft are each larger than every stock in the Russell 2000 Index combined.
More concentration and big valuations can lead to less diversification.
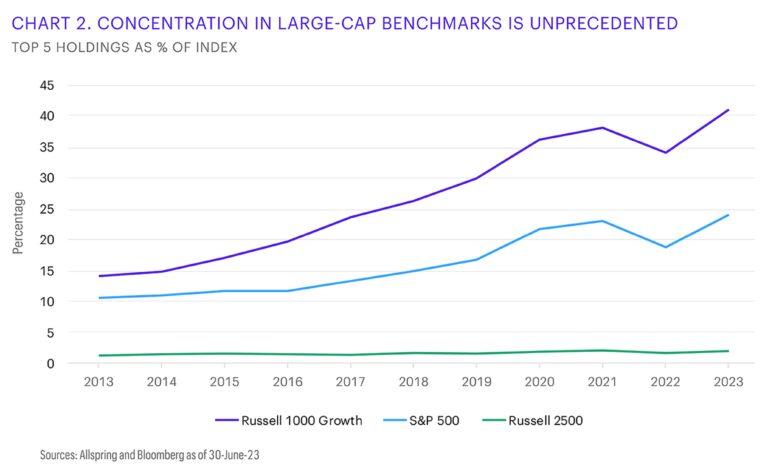
Apart from a brief reprieve in 2022 when value stocks outperformed and the narrowness among large-cap indexes waned, 2023’s tech rally has caused the concentration within the Russell 1000® Growth Index and the S&P 500 Index to grow to unprecedented heights. While the business models of the five largest U.S. stocks (Apple, Microsoft, Alphabet, Amazon, and NVIDIA) have many advantages—including sticky ecosystems, mature installed bases, vast economies of scale, large addressable markets, and strong balance sheets—their enormous market caps are accompanied with commensurately high valuations relative to the rest of the market. For example, as of June 30, 2023, the average forward price-to-earnings ratio for those five largest stocks is 38 times—double that of the S&P 500 Index (at 19 times).
Moreover, because of the increasingly wider representation these five have within large-cap benchmarks, every dollar invested in passive strategies that mirror these benchmarks produces diminishing marginal diversification benefits—which could cause a seemingly balanced portfolio to become more vulnerable to idiosyncratic risks.
Mid and small caps could be catalyzed by the physical economy.
Over the past several years, many large- and mega-cap stocks have enjoyed sustainably higher profit margins due partially to a globalized, lower inflationary backdrop. However, as supply constraints became more challenging throughout the COVID pandemic, the fragility of global supply networks prompted many corporations to move their operations back to the U.S. In addition, the post-COVID hangover exposed the chronic underinvestment in U.S. infrastructure and has crystalized the need for companies to be more exposed to the physical economy.
We believe firms that stand to benefit from the reshoring and infrastructure movement are not the digitally oriented mega-cap behemoths that have dominated markets over the past decade. Rather, we contend that the winners in this new regime could be the small- and mid-cap industrials stocks tied to the physical capital expenditure movement.
Wide valuation spread favors mid and small caps.
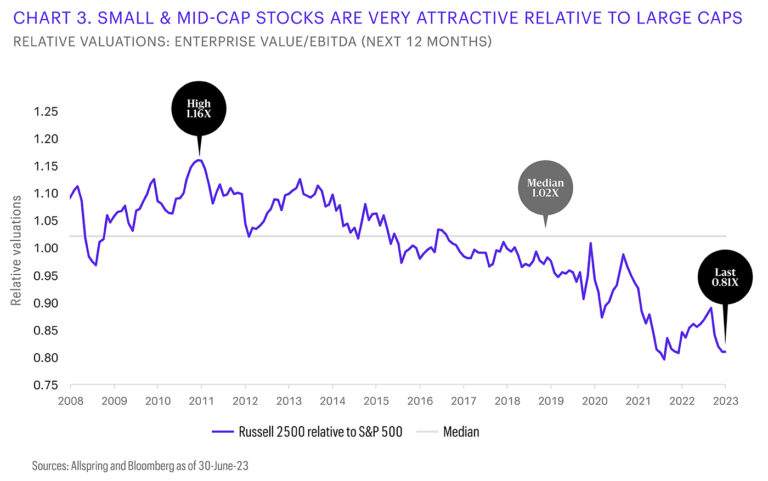
Given the return disparity between mega- and large-cap stocks relative to mid- and small-cap stocks over the past several years, that’s exacerbated by the leadership of select massive tech companies, the valuation dispersion between the groups is at drastic extremes. As of June 30, 2023, the Russell 2500™ Index (a good proxy for mid- and small-cap stocks) is trading at its largest discount in 15 years, from an enterprise value-to-EBITDA (earnings before interest, taxes, depreciation, and amortization) perspective.
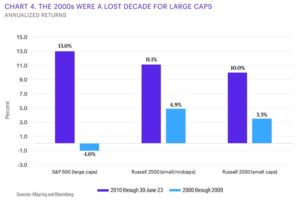
Because large caps have been the demonstrative leaders since 2010, many investors have been conditioned to believe their dominance will persist forever. However, this recency bias has caused many to forget that large caps went through a lost decade during the 2000s, generating a negative total return (-1.0%) while underperforming their smaller-cap counterparts by over 450 basis points (bps; 100 bps equal 1.00%).

Conclusion
Many investors believe the select mega-cap technology stocks that dominate the indexes will continue to disrupt legacy business models, repel impending competition, and enjoy the same globalized backdrop they’ve operated in for years. Although these companies possess many advantages, they’ve become so large that changes to economic conditions could have a significant impact on their businesses.
This dynamic, coupled with their elevated valuations and acute index concentration, present risks. Also, it’s possible that a new paradigm could emerge where mega-cap technology stocks surrender their leadership to mid- and small-cap stocks more tied to the physical economy. Consequently, investors looking to tactically allocate to equities or rebalance their portfolios may want to consider mid- and small-cap stocks as sources of increased diversification and potential outperformance.
—
Originally Posted August 4, 2023 – Concentration consternation
Diversification does not ensure or guarantee better performance and cannot eliminate the risk of investment losses.
Price-to-earnings ratio is the price of a share of a stock divided by earnings per share, usually calculated using the latest year’s earnings.
Disclosure: Interactive Brokers
Information posted on IBKR Campus that is provided by third-parties does NOT constitute a recommendation that you should contract for the services of that third party. Third-party participants who contribute to IBKR Campus are independent of Interactive Brokers and Interactive Brokers does not make any representations or warranties concerning the services offered, their past or future performance, or the accuracy of the information provided by the third party. Past performance is no guarantee of future results.
This material is from Allspring Global Investments and is being posted with its permission. The views expressed in this material are solely those of the author and/or Allspring Global Investments and Interactive Brokers is not endorsing or recommending any investment or trading discussed in the material. This material is not and should not be construed as an offer to buy or sell any security. It should not be construed as research or investment advice or a recommendation to buy, sell or hold any security or commodity. This material does not and is not intended to take into account the particular financial conditions, investment objectives or requirements of individual customers. Before acting on this material, you should consider whether it is suitable for your particular circumstances and, as necessary, seek professional advice.


Join The Conversation
If you have a general question, it may already be covered in our FAQs. If you have an account-specific question or concern, please reach out to Client Services.