


It’s easy for investors to fall into a rut. Even though I spent the first few years of my career trading global stock markets, I’m as guilty as anyone about becoming too focused on US stocks. It’s a big world out there – don’t be afraid to invest in it. And if you have an account at Interactive Brokers, our global breadth will allow you to do just that.[1]
While any US-based market participant can confidently assert that major indices like the S&P 500 (SPX) and Nasdaq 100 (NDX) are flirting with all-time highs, I suspect that many fewer realize that a wide range of international benchmarks are doing something similar. It was newsworthy when Japan’s Nikkei 225 (N225) recently breached its prior all-time high set during that country’s “bubble era” during the last century, but the wide range of European markets, like the Euro Stoxx50 (ESTX50, SXS5E), Germany’s DAX, and FTSE100 (UKX), that are at or near all-time highs may be less headline-grabbing, yet still quite noteworthy.
The graphs below show how well ESTX50 and DAX have kept up with SPX over the past three years and six months, even if NDX outpaces them nonetheless:
3-Year Graph, ESTX50 (white), DAX (blue), NDX (purple), SPX (yellow)
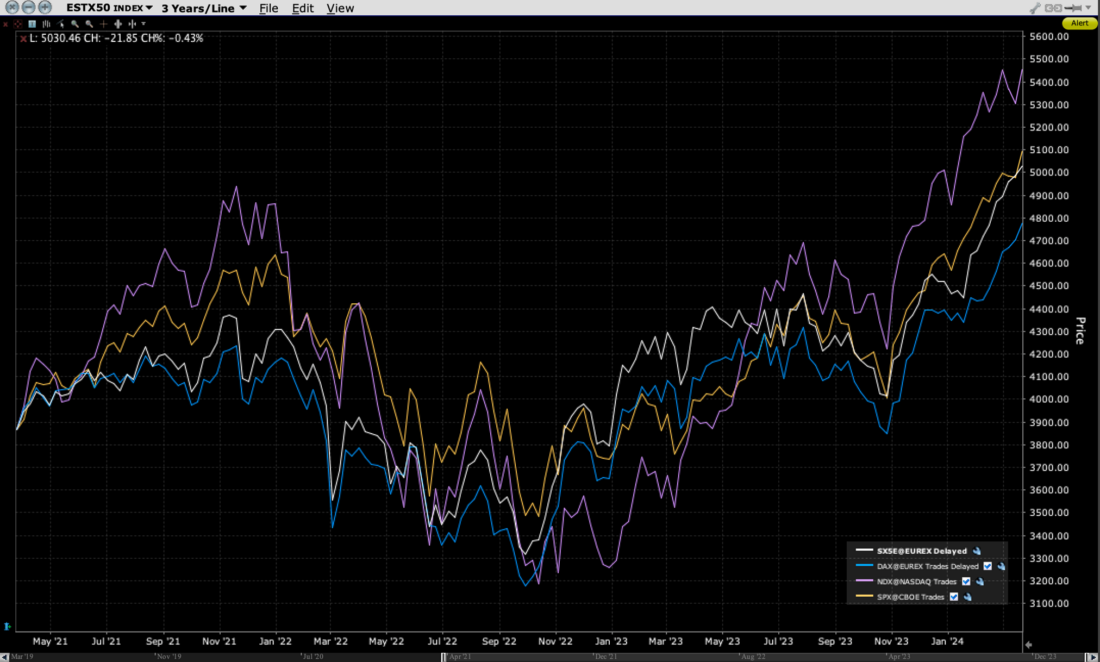
Source: Interactive Brokers
6-Month Graph, ESTX50 (white), DAX (blue), NDX (purple), SPX (yellow)
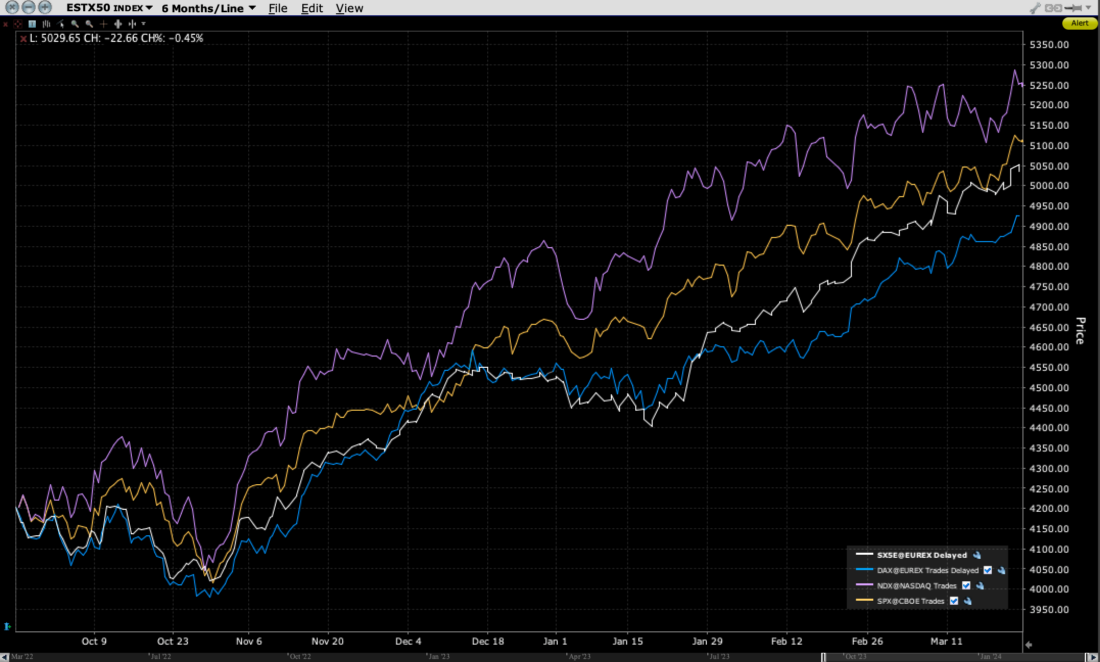
Source: Interactive Brokers
Below are graphs that show how well selected Australasian indices, including Hong Kong’s Hang Seng (HIS) and Australia’s S&P/ASX 200 (SPI) have done over those same timeframes – with one obvious exception:
3-Year Graph, N225 (white), HSI (blue), NDX (purple), SPI (yellow), SPX (red)
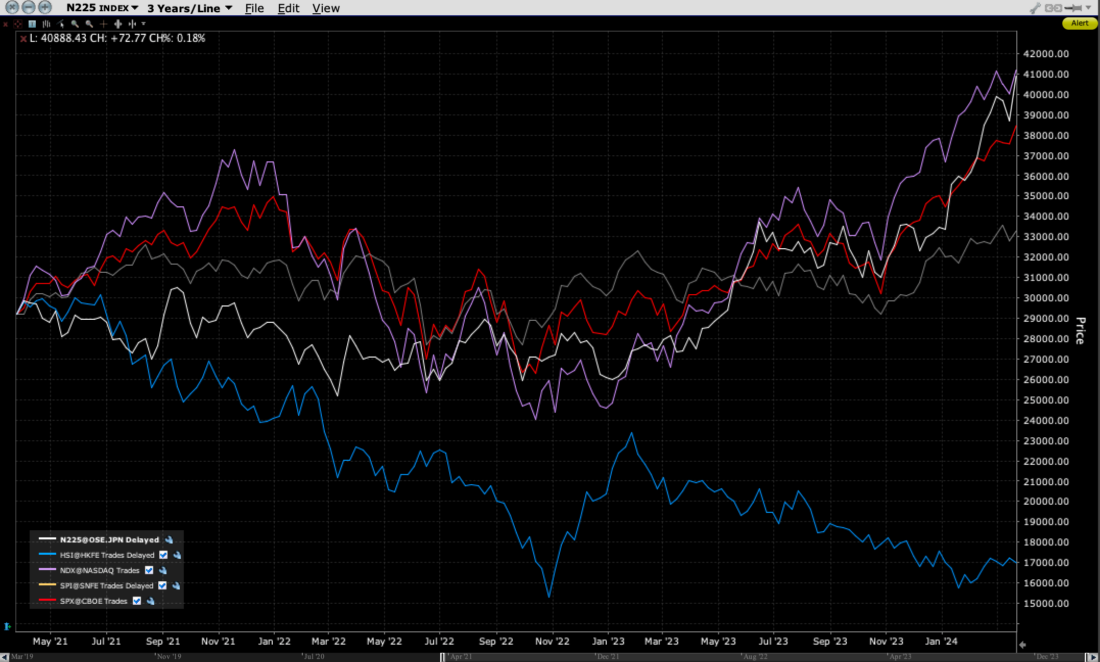
Source: Interactive Brokers
6-Month Graph, N225 (white), HSI (blue), NDX (purple), SPI (yellow), SPX (red)
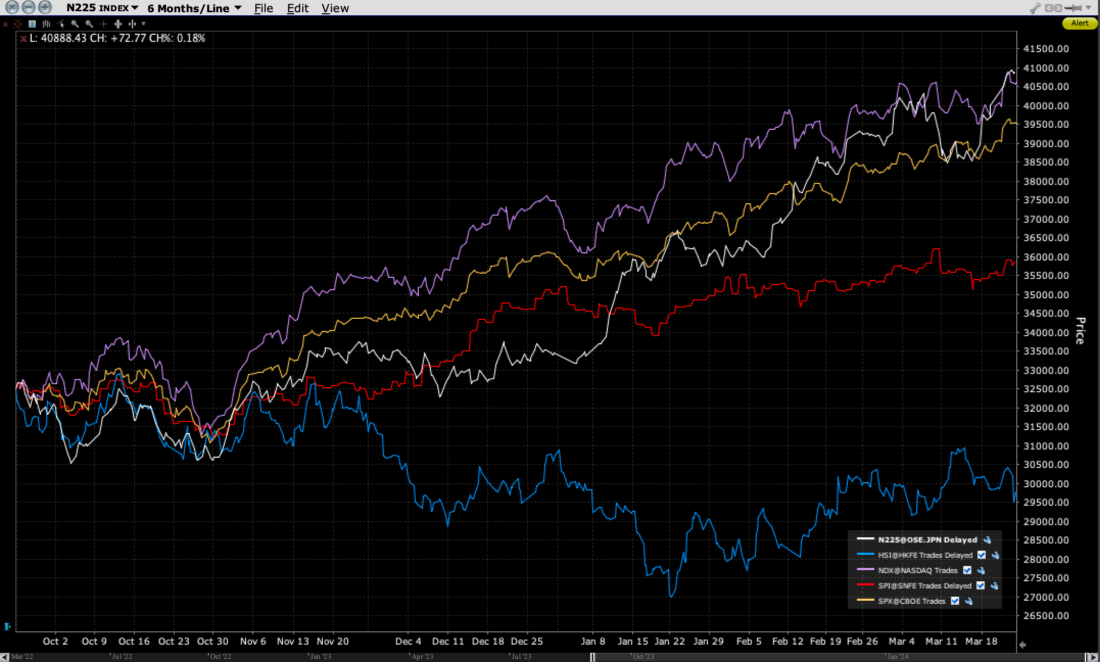
Source: Interactive Brokers
Those who invest in greater China are sadly aware of the underperformance of stocks in that region, and China’s economic malaise is also causing some dismay in Australia by depressing demand for that country’s copious supplies of raw materials.
Unfortunately, the latter chart somewhat dispels one of the classic rationales for investing globally – diversification. It is obvious that international investment can increase the diversity of stocks within one’s portfolio, but that is not always an end goal in itself. If global markets are moving in relative lockstep, the need for – and the ability for – international diversification diminishes. When one of the few markets that is offering diversification of returns is doing so because it is a glaring underperformer, it is hardly an endorsement of the practice. But that also doesn’t mean that one should turn a blind eye to the rest of the world.
Remember, while most of the world is focused on the prospects for artificial intelligence (AI), one of the best performing stocks in the world has benefitted immensely from the fundamental human desire to look better. We’re of course referring to Novo Nordisk (NOVO, NVO), which we recently called “the other “NV*” stock.”. Over the past 18 months, when awareness about both AI and GLP-1 drugs took root among the general population, we can see that NVO has kept pace with its key competitor, Eli Lilly (LLY), but that divergences between the two GLP-1 giants have occurred with frequency. Sure, NVO is no Nvidia (NVDA), but what is? NVO and LLY have outpaced other stellar performers like Meta Platforms (META) and Microsoft (MSFT), along with NDX over the past year and a half.
18-Month Chart, NVO (white), LLY (purple), META (yellow), MSFT (grey), NVDA (green), NDX (red)
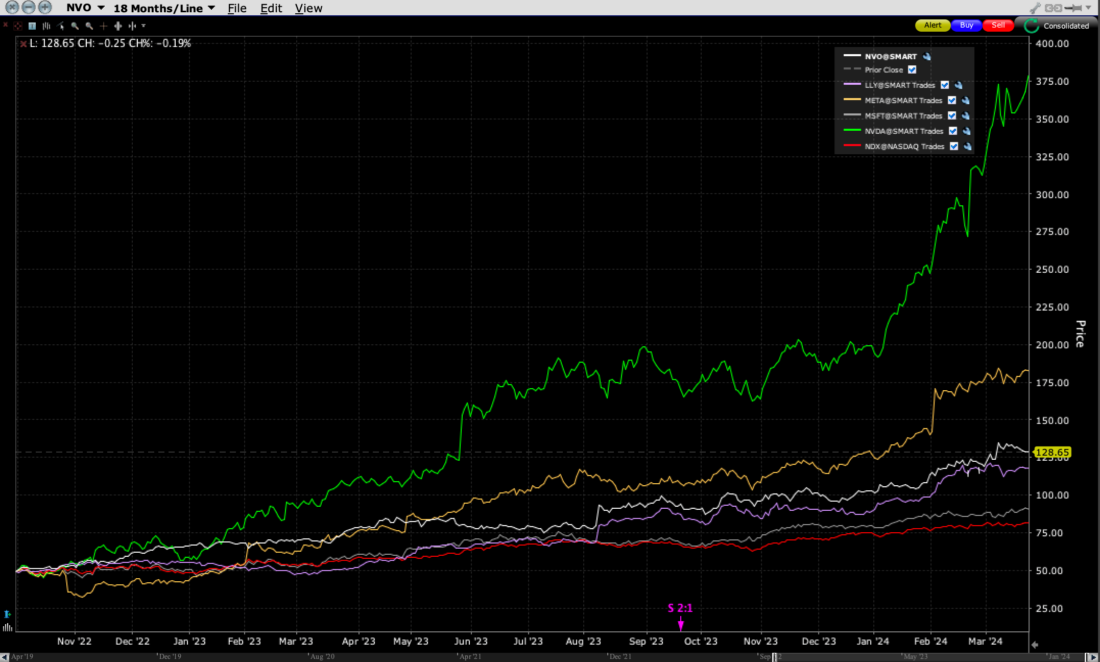
Source: Interactive Brokers
Although it is quite easy to access its ADRs during normal US market hours, there are often trading opportunities that early risers or insomniacs can take advantage of. And there are literally thousands of other global stocks and indices that one can trade on our platform throughout the day and night. Let’s be clear – I don’t advocate forgoing sleep, family time, and other productive activities, but it is useful to know that if an idea hits, one can act upon it right then and there.
—
[1] Here is a list of global exchanges that Interactive Brokers’ customers can access: https://www.interactivebrokers.com/en/whyib/global_access.php
Join The Conversation
If you have a general question, it may already be covered in our FAQs. If you have an account-specific question or concern, please reach out to Client Services.
Leave a Reply
Disclosure: Interactive Brokers
The analysis in this material is provided for information only and is not and should not be construed as an offer to sell or the solicitation of an offer to buy any security. To the extent that this material discusses general market activity, industry or sector trends or other broad-based economic or political conditions, it should not be construed as research or investment advice. To the extent that it includes references to specific securities, commodities, currencies, or other instruments, those references do not constitute a recommendation by IBKR to buy, sell or hold such investments. This material does not and is not intended to take into account the particular financial conditions, investment objectives or requirements of individual customers. Before acting on this material, you should consider whether it is suitable for your particular circumstances and, as necessary, seek professional advice.
The views and opinions expressed herein are those of the author and do not necessarily reflect the views of Interactive Brokers, its affiliates, or its employees.


Another neat article from you, Steve. I’ve gotten into the habit of taking a hard look at your analyses, lately. Very insightful, IMHO. Thanks-a-mil!
We hope you continue to enjoy Traders’ Insight!
Yes, of course we will be happy.