


- Last week, the trio of DBS, UOB and OCBC averaged 3.4% gains, bringing their average 3Q23-to-date total return to 8.7%. The weekly gain was aligned with global banks that outperformed the stock market, particularly in Japan, US and Europe on the outlook for dealmaking and capital formation that coincided with the US$55 billion Arm IPO.
- Fitch Ratings also made a marginal upward revision to its 2023 growth outlook to 2.5% (from 2.4% in June), however downgraded its 2024 growth outlook to 1.9% (from 2.1% in June) last week. Meanwhile, in China, the PBOC delivered a 25bps RRR cut, while also seeing stronger than expected IP & retail sales activity in August.
- The 3Q23-to-date has seen the trio of DBS, UOB & OCBC report combined 2Q23 Net Interest Income (NII) of S$8.26 billion, marking the third-consecutive quarter that combined quarterly NII has been above the S$8.0 billion mark. Combined quarterly NII of the trio broke above S$5.0 billion in 1Q18 and stayed between S$5.0 billion and S$6.0 billion for just over four years through to 1Q22, before breaking above S$6.0 billion in 2Q22.
- On the leveraged trading front, the most traded Daily Leverage Certificates so far this month that track the banks have been the OCBC 5xLongSG250226, UOB 5xShortSG240306 and OCBC 5xShortSG250226. A pairs trade of the OCBC 5xLongSG250226 and UOB 5xShortSG240306 generated an indicative return of 2.1% last week.
Last week, the Bank Sector led the global stock market, which coincided with Softbank’s Arm Holdings making a successful listing, potentially heralding a positive turnaround in the IPO market. DBS Group Holdings (DBS), United Overseas Bank (UOB) and Oversea-Chinese Banking Corporation (OCBC) also moved in tandem averaging a 3.4% gain on the week. As tabled below, CapitaLand Investment also gained 2.9% on the week, while Yangzijiang Financial Holding added 1.4%.
| Most Traded Stocks of the Financial Services Sector | Code | YTD Avg. Daily T/O (S$) | Mkt Cap S$M | Week to 15 Sep TR % | Week to 15 Sep Net Insti. Flow S$M | QTD TR % | YTD TR % | YTD Net Insti. Flow S$M | P/B (x) | 5-yr Avg P/B (x) | 5-yr TR % |
| DBS | D05 | 127.1 | 88,311 | 3.0 | -7.4 | 10.2 | 6.7 | -1,007 | 1.50 | 1.32 | 74 |
| UOB | U11 | 84.2 | 48,835 | 3.3 | 11.5 | 7.4 | 0.5 | -624 | 1.07 | 1.06 | 40 |
| OCBC Bank | O39 | 62.3 | 58,025 | 3.8 | 4.1 | 8.4 | 12.8 | -17 | 1.10 | 1.03 | 44 |
| CapitaLandInvest | 9CI | 24.2 | 16,492 | 2.9 | -5.2 | -2.7 | -8.7 | -100 | 1.06 | 1.23 | 17 |
| YZJ Fin Hldg | YF8 | 3.28 | 1,343 | 1.4 | -1.2 | 8.8 | 9.4 | 21 | 0.35 | 0.35 | -39 |
| Great Eastern | G07 | 0.60 | 8,614 | -0.1 | -0.2 | 5.1 | 3.5 | 27 | 1.18 | 1.18 | -21 |
Note 5-yr statistics for CapitaLand Investment from 20 Sep 2021 for YZJ Financial Hldg from 28 April 2022. Table does not include Singapore Exchange.
Source: SGX, Refinitiv, Bloomberg (Data as of 15 Sep 2023)
The 3Q23-to-date has seen the trio of DBS, UOB and OCBC average an 8.7% total return. The trio have marginally increased their combined weight in the FTSE ASEAN All-Share and Global Bank Indices since the end of June. The three banks are among the five biggest weights of the FTSE ASEAN Index, and 10 biggest weights of the FTSE ASEAN Target Dividend Index, with the latter a part of a new global series that maintains a dividend yield uplift target, while attempting to mitigate risks of a yield trap.
For 2Q23, DBS, UOB and OCBC reported combined Net Interest Income (NII) of S$8.26 billion. This was the third-consecutive quarter that the combined quarterly NII was reported above the S$8.0 billion mark. As illustrated below combined quarterly NII of the trio broke above S$5.0 billion in 1Q18 and stayed between S$5.0 billion and S$6.0 billion for just over four years through to 1Q22, before breaking above S$6.0 billion in 2Q22.
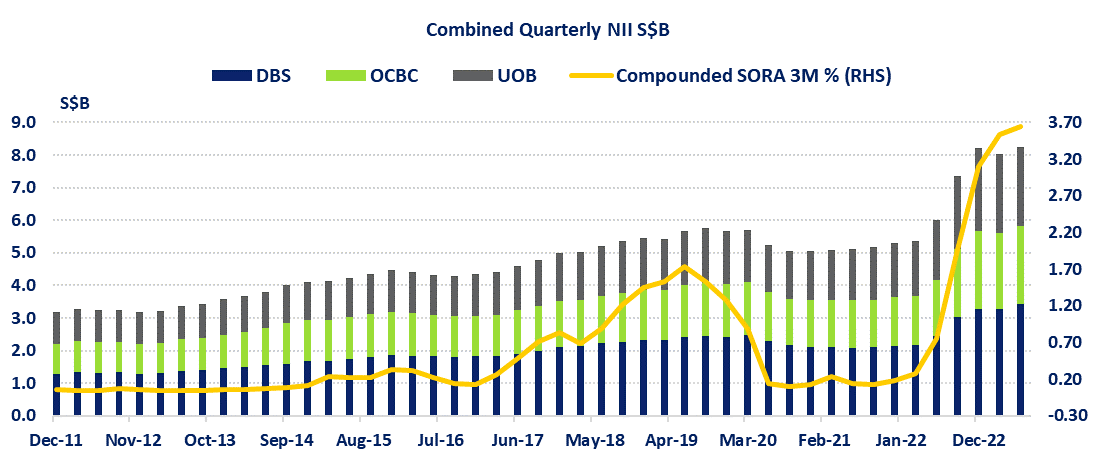
Source: SGX, Refinitiv, Bloomberg.
NII which is predominately driven by Net Interest Margins and loan growth, has recently comprised around two-thirds of the total income of the DBS, UOB and OCBC. Meanwhile, the total Non-Interest Income (NOII) for the trio was up 20% in 1H23 from 1H22, partially attributed to UOB’s record high customer-related treasury income from increased hedging demands and good performance from trading and liquidity management activities. NPL ratios for 1H23 compared to the end of 2022 remained the same for DBS at 1.1% and 1.6% for UOB, while down to 1.1% from 1.2% for OCBC.
While DBS, UOB and OCBC are currently not priced at discounts to their 5-year average price-to-book ratio, they are trading below their Refinitiv consensus estimates of S$37.55, S$32.347 and S$14.328. The Friday close prices of the trio were at S$34.24, S$29.20 and S$12.90. Similarly, as of Friday, Indonesia-listed Bank Central Asia Tbk PT and Bank Rakyat Indonesia (Persero) Tbk PT were trading below their Refinitiv consensus estimates and at premiums to their 5-year average price-to-book ratio. These Refinitiv consensus estimates represent the average of individual estimates provided by analysts covering the stocks and estimates typically represent an analyst’s opinion of the company performance over the next 18 months.
Looking forward, Fitch Ratings made a marginal upward revision to its 2023 growth outlook to 2.5% (from 2.4% in June), however downgraded its 2024 growth outlook to 1.9% (from 2.1% in June). Meanwhile, in China, the PBOC cut the reserve requirement ratio (RRR) for all banks, except those that have implemented a 5% reserve ratio, by 25 basis points. At the same time China economic reports saw stronger than expected Industrial Production and Retail Sales activity in August. Over to the US, and while the FOMC is not expected to change the Fed Funds Rate this week, the odds for another Fed Funds Rate hike before 2024 marginally declined.
On the leveraged trading front, the most traded Daily Leverage Certificates (DLCs) that track the performances of the three banks have been the OCBC 5xLongSG250226, UOB 5xShortSG240306 and OCBC 5xShortSG250226. A pairs trade of the OCBC 5xLongSG250226 and UOB 5xShortSG240306 generated an indicative return of 2.1% last week. Over the week the OCBC 5xLongSG250226 increased 19.4% from 0.501 per unit to 0.598 per unit, and the UOB 5xShortSG240306 declined 15.2% from 0.578 to 0.490. This corresponded with the share price of OCBC increasing 3.8% and the share price of UOB increasing 3.3%.
DLCs are SIPs and seek to achieve short-term investment results that correspond to the daily magnified performance of the underlying index or stock. If the trading horizon is over a few days, it is important to note that the performance of the DLC may vary from the leverage factor of the DLC. This is because the performance of the underlying asset and the DLC is reset at the end of each trading day and funding costs are incurred when holding the DLC overnight.
—
Originally Posted September 18, 2023 – Global Banks Led Stocks on the Week with Arm IPO & Growth Outlook
Disclosure: Interactive Brokers
Information posted on IBKR Campus that is provided by third-parties does NOT constitute a recommendation that you should contract for the services of that third party. Third-party participants who contribute to IBKR Campus are independent of Interactive Brokers and Interactive Brokers does not make any representations or warranties concerning the services offered, their past or future performance, or the accuracy of the information provided by the third party. Past performance is no guarantee of future results.
This material is from Singapore Exchange and is being posted with its permission. The views expressed in this material are solely those of the author and/or Singapore Exchange and Interactive Brokers is not endorsing or recommending any investment or trading discussed in the material. This material is not and should not be construed as an offer to buy or sell any security. It should not be construed as research or investment advice or a recommendation to buy, sell or hold any security or commodity. This material does not and is not intended to take into account the particular financial conditions, investment objectives or requirements of individual customers. Before acting on this material, you should consider whether it is suitable for your particular circumstances and, as necessary, seek professional advice.
Disclosure: Alternative Investments
Alternative investments can be highly illiquid, are speculative and may not be suitable for all investors. Investing in Alternative investments is only intended for experienced and sophisticated investors who have a high risk tolerance. Investors should carefully review and consider potential risks before investing. Significant risks may include but are not limited to the loss of all or a portion of an investment due to leverage; lack of liquidity; volatility of returns; restrictions on transferring of interests in a fund; lower diversification; complex tax structures; reduced regulation and higher fees.


Join The Conversation
If you have a general question, it may already be covered in our FAQs. If you have an account-specific question or concern, please reach out to Client Services.