


- The 5.2% gain on the month was the STI’s strongest performing month since a 6.4% gain in November 2022, with the STI trading at March levels (below 3,150) in early July, then retesting February levels (above 3,350) in late July. This brings the STI’s total return over the first seven months of 2023 to 6.5%.
- Going into July, broad market sentiment was weighed by the potential impact of decelerating growth on corporate earnings and outlooks. However, the earnings season thus far has seen more upside surprises than downside surprises, in the US, across ASEAN and in Singapore. August is a particularly important month for 1HFY23 reporting in Singapore.
- Seatrium led the STI constituents in July, gaining 12.8% while booking the highest net institutional inflow for the month at S$75.4 million. Keppel Corp was the STI’s second strongest performer in July and reported its highest profit on record in its 55-year history which was underpinned by the S$3.3 billion disposal gain from the divestment of the O&M business.
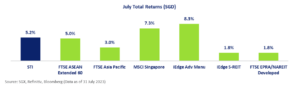
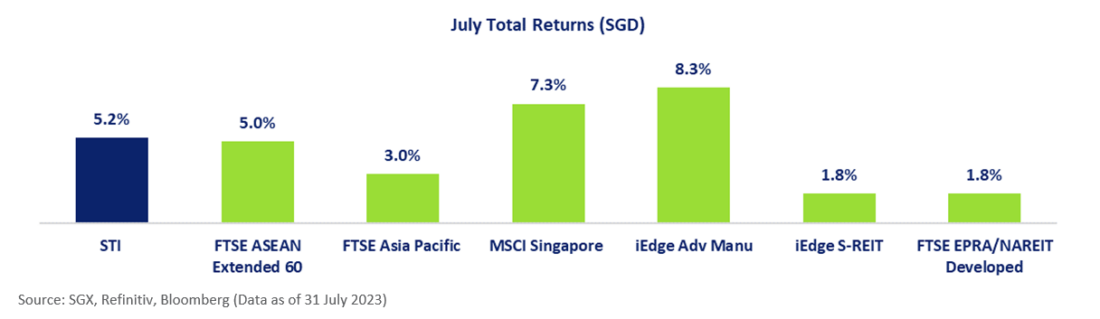
The STI’s 5.2% gain in July to 3,373.98 marked the Singapore benchmark’s strongest performing month since lodging a 6.4% gain in November 2022. The month saw the STI test at March levels (below 3,150) in early July, then retest February levels (above 3,350) in late July. Comparative Index returns for July in SGD terms are tabled below which take into account the USD/SGD depreciation of 1.7% to 1.33 over the month.
The three banks began July with a combined 44.7% weight in the STI and a 45.5% weight in the MSCI Singapore Index. The trio averaged 8.2% gains on the month. UOB reported its 2QFY22 Net Interest Income grew 31% YoY, while other non-interest income rose sharply on higher customer-related treasury income and strong performance from trading and liquidity management activities.
Going into July, the impact of decelerating growth on broader corporate earnings and 2H23 outlooks was a growing concern, however the earnings season thus far has seen more upside surprises than downside surprises, in the US, across ASEAN and in Singapore. The next three weeks will be particularly important for 1HFY23 reporting in Singapore, as the local earnings season presses on. DBS Group Holdings will report on 3 August and Oversea-Chinese Banking Corporation reports on 5 August.
For the month. the Singapore stock market booked net institutional outflow in the vicinity of S$220 million, bringing the total net institutional outflow for the past seven months to S$2.9 billion. In July, the number of stocks that booked net institutional outflow was fairly level with the number of stocks that booked net institutional inflow.
Seatrium Led STI Stocks in July, followed by Keppel Corporation
Seatrium led the STI constituents over the month with a 12.8% price gain with S$75.4 million of net institutional inflow. During the month, the newest STI addition announced it had secured a Green Trade Finance Facility from OCBC worth an estimated S$1.04 billion. Seatrium reported revenue of S$2.9 billion for 1HFY23, and while it still reported a net loss in 1HFY23, management noted key measures are being worked on to steer the Group back to net profitability which includes the streamlining of the Group’s cost structure and the completion of the ongoing capital restructuring. Seatrium’s acting group finance director said the company’s financial results “reflect the completion” of its combination with Keppel O&M, now known as Seatrium O&M and without the provisions for those expenses, its net loss for the period would have been S$33 million, rather than the reported S$264 million attributable net loss. Seatrium secured S$4.3 billion of new orders in 1HFY23, bringing its net order book to over S$19 billion (Including two of three contracts for the supply of the HVDC systems for TenneT) with deliveries till 2030. Renewables and cleaner/green solutions comprise approximately 40% of this net order book.
Keppel Corporation was the STI second strongest performer in July and reported its highest profit on record in the Company’s 55-year history which was underpinned by the S$3.3 billion disposal gain from the divestment of the O&M business. Real Estate Developers, in addition to Banks. were also among the strongest performing global sectors in July, coinciding with City Developments and UOL Group ranking as the STI’s third and fourth strongest stocks for the month, and DBS Group Holdings ranking as the fifth strongest performer on the month.
Global expectations are currently anchored to July’s US Fed Funds Rate (FFR) hike to 5.25% to 5.50% being the last hike for the current tightening cycle. There is still some 30% of the market expecting that the Fed Funds Rate will be 25bps higher going into 2024 and all four of the incoming FOMC 2024 voters, Tom Barkin, Raphael Bostic, Mary Daly, and Loretta Mester acknowledged in July that US inflation was still too high. The PCE Core Deflator returned to 4.1% in June 2023 from 4.6% in May, which is the lowest level since 3.9% in Sep 2021, however there is still much ground to cover before the gauge returns to previous 2.1% highs seen in 2018. The current hypothesis of the Fed doves is that the full impact of past hikes is yet to be realised on inflation and given the Fed’s sub-mandate of being data dependent, the FFR is potentially at its peak.
The least performing STI constituent for the month was Hongkong Land which reported that while its 1HFY23 underlying profit was in line with 1HFY22, there was a loss attributable to shareholders of US$333 million in 1HFY23, compared to a profit of US$292 million in 1HFY22. Management noted that the figure reflected unrealised losses mainly arising from Investment Properties revaluations of US$755 million and US$133 million in 1HFY23 and 1HFY22, respectively with the 2023 revaluation loss principally attributable to the Hong Kong office portfolio following a modest decrease in market rents and a slight cap rate expansion.
The 30 STI stocks are tabled below and ranked by performances in July.
| STI Stocks | Code | Mkt Cap S$M | YTD Avg Daily Turnover S$M | YTD Net Insti. Flow S$M | YTD Total Return % | July Net Insti. Flow S$M | July Price Change % | P/B (x) | 5 Year Avg P/B (x) | Ind Div Yield % |
| Seatrium | S51 | 9,621 | 43.2 | 132.6 | 2.2 | 75.4 | 12.8 | 1.2 | 0.9 | 0.0 |
| Keppel Corp | BN4 | 13,005 | 29.2 | -172.1 | 60.6 | -15.1 | 10.0 | 1.2 | 0.7 | 4.6 |
| CityDev | C09 | 6,702 | 13.5 | -133.8 | -8.1 | 13.4 | 10.0 | 0.7 | 0.7 | 1.1 |
| UOL | U14 | 5,939 | 7.3 | 11.1 | 7.3 | 8.6 | 9.5 | 0.6 | 0.6 | 2.2 |
| DBS | D05 | 88,360 | 133.8 | -1,328.1 | 5.2 | 31.3 | 8.7 | 1.5 | 1.3 | 4.6 |
| SATS | S58 | 4,173 | 16.5 | -57.9 | 4.3 | 8.1 | 8.5 | 1.8 | 2.8 | 0.0 |
| OCBC Bank | O39 | 59,782 | 62.2 | -113.5 | 12.8 | 5.3 | 8.3 | 1.1 | 1.0 | 5.1 |
| UOB | U11 | 50,390 | 89.5 | -840.6 | 0.7 | -151.3 | 7.5 | 1.1 | 1.1 | 5.4 |
| CapLand IntCom T | C38U | 13,569 | 37.0 | -93.6 | 2.6 | 9.3 | 6.8 | 1.0 | 1.1 | 5.2 |
| Singtel | Z74 | 43,918 | 50.6 | -170.5 | 3.5 | 32.4 | 6.4 | 1.7 | 1.6 | 3.7 |
| SIA | C6L | 22,396 | 47.4 | 111.0 | 36.2 | -2.7 | 5.3 | 1.1 | 0.8 | 5.0 |
| Mapletree Log Tr | M44U | 8,354 | 23.9 | -7.0 | 9.2 | -3.4 | 4.3 | 1.1 | 1.3 | 5.0 |
| ThaiBev | Y92 | 15,200 | 16.5 | -47.0 | -8.5 | 10.1 | 4.3 | 2.1 | 3.0 | 4.0 |
| CapLand Ascendas REIT | A17U | 12,337 | 31.5 | -43.4 | 7.8 | -14.3 | 3.3 | 1.2 | 1.3 | 4.9 |
| CapitaLandInvest | 9CI | 17,414 | 24.8 | -90.3 | -3.6 | -35.5 | 2.7 | 1.1 | 1.2 | 3.6 |
| YZJ Shipbldg SGD | BS6 | 6,084 | 33.9 | -13.4 | 17.9 | 3.0 | 2.7 | 1.9 | 0.6 | 3.3 |
| Mapletree PanAsia Com Tr | N2IU | 8,652 | 15.8 | -62.5 | 1.4 | -22.8 | 1.9 | 0.9 | 1.1 | 5.7 |
| Venture | V03 | 4,359 | 15.2 | -98.7 | -9.4 | -19.5 | 1.8 | 1.5 | 2.0 | 5.1 |
| Wilmar Intl | F34 | 24,097 | 23.3 | 15.0 | -4.9 | 9.1 | 1.6 | 0.9 | 1.1 | 4.4 |
| ST Engineering | S63 | 11,627 | 15.9 | 35.2 | 13.8 | -9.2 | 1.4 | 4.8 | 5.2 | 4.3 |
| Mapletree Ind Tr | ME8U | 6,344 | 10.3 | -31.5 | 4.9 | -7.0 | 1.4 | 1.1 | 1.5 | 5.9 |
| SGX | S68 | 10,370 | 16.7 | 68.6 | 10.4 | -8.5 | 1.0 | 7.0 | 7.9 | 3.3 |
| Genting Sing | G13 | 11,348 | 32.9 | 101.7 | 0.3 | -37.4 | 0.0 | 1.4 | 1.3 | 3.2 |
| Jardine C&C | C07 | 13,549 | 12.9 | 4.6 | 24.0 | -8.3 | -1.5 | 1.3 | 1.2 | 4.4 |
| Emperador Inc. | EMI | 8,026 | 0.8 | -0.7 | 1.4 | -2.6 | -1.9 | 3.6 | 2.8 | 1.4 |
| Frasers L&C Tr | BUOU | 4,542 | 11.8 | -20.6 | 8.1 | -22.8 | -2.4 | 1.0 | 1.2 | 5.8 |
| DFIRG USD | D01 | 4,841 | 1.8 | 15.7 | -8.3 | -1.4 | -3.9 | 3.8 | 5.7 | 1.8 |
| JMH USD | J36 | 19,025 | 18.1 | -12.4 | -0.5 | -11.3 | -4.2 | 0.5 | 0.7 | 4.3 |
| Sembcorp Ind | U96 | 9,733 | 21.9 | 151.4 | 64.3 | -18.5 | -5.2 | 2.4 | 0.8 | 1.4 |
| HongkongLand USD | H78 | 10,483 | 10.5 | -40.1 | -20.3 | -27.9 | -10.3 | 0.2 | 0.3 | 6.1 |
—
Originally Posted August 1, 2023 – STI Rebounds 5.2% in July, led by Seatrium & Keppel Corp
Disclosure: Interactive Brokers
Information posted on IBKR Campus that is provided by third-parties does NOT constitute a recommendation that you should contract for the services of that third party. Third-party participants who contribute to IBKR Campus are independent of Interactive Brokers and Interactive Brokers does not make any representations or warranties concerning the services offered, their past or future performance, or the accuracy of the information provided by the third party. Past performance is no guarantee of future results.
This material is from Singapore Exchange and is being posted with its permission. The views expressed in this material are solely those of the author and/or Singapore Exchange and Interactive Brokers is not endorsing or recommending any investment or trading discussed in the material. This material is not and should not be construed as an offer to buy or sell any security. It should not be construed as research or investment advice or a recommendation to buy, sell or hold any security or commodity. This material does not and is not intended to take into account the particular financial conditions, investment objectives or requirements of individual customers. Before acting on this material, you should consider whether it is suitable for your particular circumstances and, as necessary, seek professional advice.


Join The Conversation
If you have a general question, it may already be covered in our FAQs. If you have an account-specific question or concern, please reach out to Client Services.