


August is widely known for its scorching heat and languid days. However, it often carries with it a unique behavioral pattern in the stock market. Historically, August has seen softer market movements, lighter trading volumes, and frequently a certain degree of pullback. But what factors contribute to this trend?
Peering into historical data reveals August as a month where the stock market might, metaphorically speaking, be sipping a chilled lemonade by the pool. Heavyweights like the S&P 500 and Dow Jones, usually humming with transactions, display a summer slumber. Contrary to other months, that may see pronounced market movements spurred by quarterly earnings or macroeconomic indicators, August remains relatively quiescent. But why?
Decoding the Historical Data: Factors Influencing August’s Stock Behavior
Obviously, this stock market rhythm isn’t just about “summer laziness”. Several underlying factors anchor August’s unique market behavior.
With traders’ jet-setting for holidays, trading desks see fewer action-packed days. Low trading volumes can make the market sway more dramatically, adding an element of surprise – volatility! Europe, in particular, sees a vast majority of its population take vacations in August. Given the interconnected nature of global markets, reduced activity from European institutional investors can impact the U.S. market’s liquidity and momentum.
Moreover, historically, September carries the notorious title of being one of the worst-performing months for stocks. As August winds down, there is a growing anticipation of this potential downturn, which can create a self-fulfilling prophecy of cautious investment strategies and reduced exposure.
Interestingly, the S&P 500 has a recurrent weak patch from August 1 to October 11. Analyzing the past 15 years, during this phase the S&P 500 has recorded an average dip of 0.56%.
Seasonal Chart of S&P 500 Index over the past 15 years
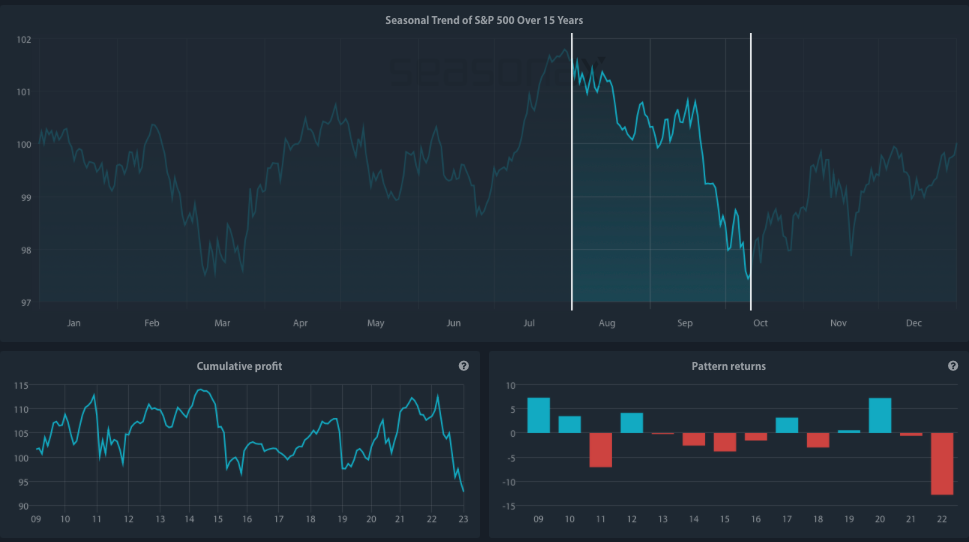
Source: Seasonax – Click the link below to access an interactive chart.
http://tiny.cc/Seasonax-SPX
Keep in mind that a seasonal chart depicts the average price pattern of a specific asset in the course of a calendar year, calculated over several years (unlike a standard price chart that simply shows prices over a specific time period). The horizontal axis depicts the time of the year, while the vertical axis shows the % change in the price (indexed to 100). The prices reflect end of day prices and do not include daily price fluctuations.
August Exceptions: The Outliers
Nevertheless, like all trends, there have been exceptions. Despite the seasonal slowdown often observed in August and September, there are always outliers in the stock market that buck the trend. Certain stocks, driven by unique catalysts or strong sector fundamentals, manage to post impressive gains even during these typically languid months.
Currently, what seems to drive this optimistic market sentiment is a combination of encouraging mid-year earnings and the Federal Reserve’s successful inflation curbing, all without triggering a recession. Also, the rise in the number of S&P 500 stocks surpassing their 200-day moving average signals a bullish market. Nevertheless, diversifying investments, especially in growing economies like Japan and India, might be a strategic move.
One notable example is TVS Motor Company, a well-known name in the Indian automotive scene. Investors often monitor this company as a barometer for the health and trajectory of the two-wheeler segment in the region.
Seasonal Chart of TVS Motor Company over the past 10 years
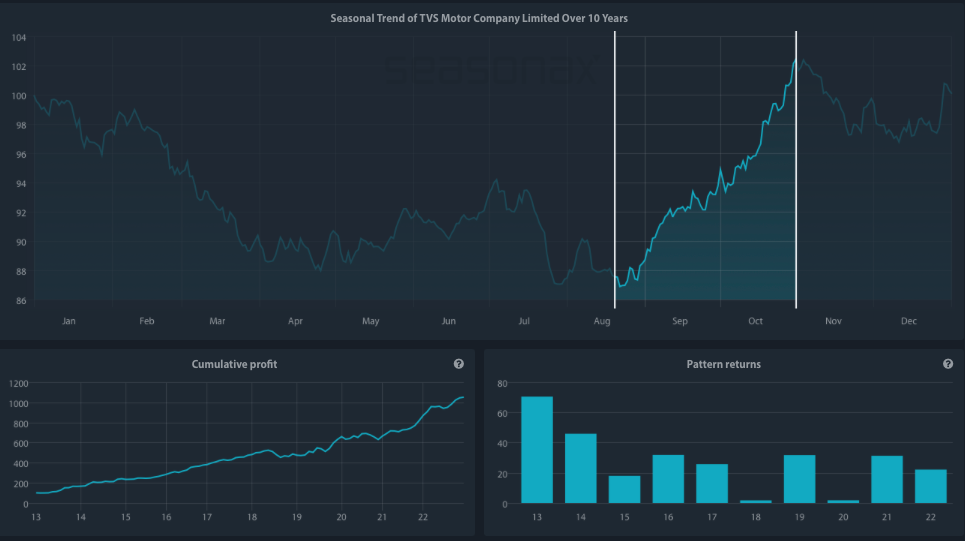
Source: Seasonax – Click the link below to access an interactive chart.
http://tiny.cc/Seasonax-TVSMotor
A quick look at the seasonal chart above is enough to see substantial peaks during August and September. What is even more astonishing is that this two-wheeler manufacturer has been delivering results like clockwork. Over the last ten years, from August 20 to October 31, there’s been a remarkable 26.87% surge within a short span of 49 trading days.
Remember, past performance is not indicative of future results. However, the significance of these recurring peaks cannot be discounted. Since 2013 this stock has recorded a 100%-win streak, putting a smile on its investors faces.
Another interesting stock for those looking to gauge the pulse of high-end retail in the Land of the Rising Sun is Isetan Mitsukoshi Holdings.
Seasonal Chart of Isetan Mitsukoshi Holdings Ltd over the past 10 years
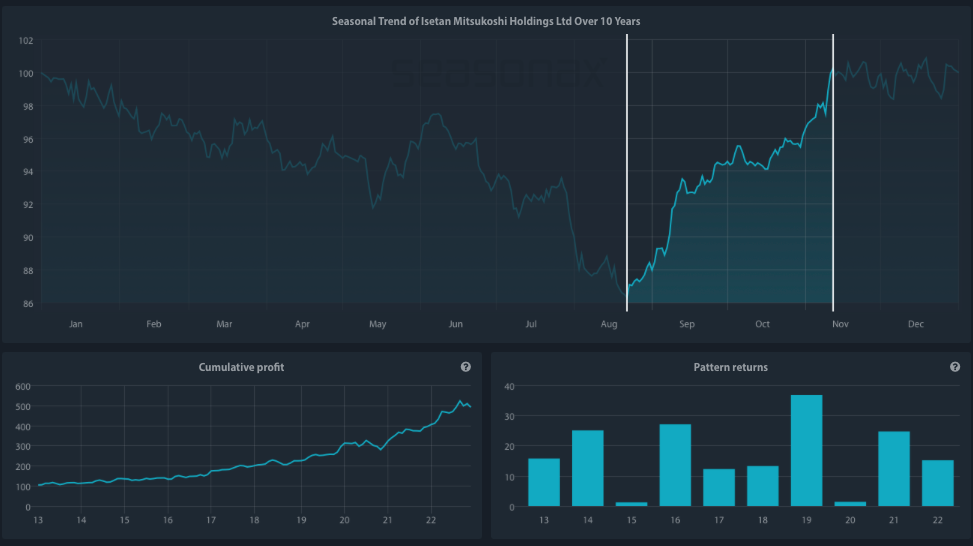
Source: Seasonax – Click the link below to access an interactive chart.
http://tiny.cc/Seasonax-IsetanMitsukoshi
Over the past decade, Isetan Mitsukoshi Holdings Ltd has showcased a remarkably consistent seasonal trend. Specifically, from August 22 to November 12, the stock has demonstrated a compelling trajectory.
The fundamental reasons can be found in the fact that during these months the company often rolls out effective marketing campaigns, targeting holiday shoppers and autumn festivals, leading to heightened investor interest.
Moreover, Japan witnesses a surge in tourism during the fall, leading to increased footfall in their retail outlets and a corresponding spike in revenue.
Wherever you choose to invest, whether in Japanese, Indian or US stocks, or anywhere else, be sure to leverage Seasonax to identify the optimal entry and exit points based on recurring patterns. When you sign up for free at www.seasonax.com, you can access over 25,000 instruments, encompassing various sectors, stocks, (crypto)currencies, commodities, and indices.
Remember, don’t just trade it, Seasonax it!
—
Originally Posted August 16, 2023 – The Dog Days of Summer: How August Affects the Stock Market
Disclosure: Seasonax
Past results and past seasonal patterns are no indication of future performance, in particular, future market trends. Seasonax GmbH neither recommends nor approves of any particular financial instrument, group of securities, segment of industry, analysis interval or any particular idea, approach, strategy or attitude nor provides consulting nor brokerage nor asset management services. Seasonax GmbH hereby excludes any explicit or implied trading recommendation, in particular, any promise, implication or guarantee that profits are earned and losses excluded, provided, however, that in case of doubt, these terms shall be interpreted in abroad sense. Any information provided by Seasonax GmbH or on this website or any other kind of data media shall not be construed as any kind of guarantee, warranty or representation, in particular as set forth in a prospectus. Any user is solely responsible for the results or the trading strategy that is created, developed or applied. Indicators, trading strategies and functions provided by seasonax GmbH or on this website or any other kind of data media may contain logical or other errors leading to unexpected results, faulty trading signals and/or substantial losses. Seasonax GmbH neither warrants nor guarantees the accuracy, completeness, quality, adequacy or content of the information provided by it or on this website or any other kind of data media. Any user is obligated to comply with any applicable capital market rules of the applicable jurisdiction. All published content and images on this website or any other kind of data media are protected by copyright. Any duplication, processing, distribution or any form of utilisation beyond the scope of copyright law shall require the prior written consent of the author or authors in question. Futures and forex trading contains substantial risk and is not for every investor. An investor could potentially lose all or more than the initial investment. Risk capital is money that can be lost without jeopardizing ones’ financial security or lifestyle. Only risk capital should be used for trading and only those with sufficient risk capital should consider trading. Past performance is not necessarily indicative of future results. Testimonials appearing on this website may not be representative of other clients or customers and is not a guarantee of future performance or success.
Disclosure: Interactive Brokers
Information posted on IBKR Campus that is provided by third-parties does NOT constitute a recommendation that you should contract for the services of that third party. Third-party participants who contribute to IBKR Campus are independent of Interactive Brokers and Interactive Brokers does not make any representations or warranties concerning the services offered, their past or future performance, or the accuracy of the information provided by the third party. Past performance is no guarantee of future results.
This material is from Seasonax and is being posted with its permission. The views expressed in this material are solely those of the author and/or Seasonax and Interactive Brokers is not endorsing or recommending any investment or trading discussed in the material. This material is not and should not be construed as an offer to buy or sell any security. It should not be construed as research or investment advice or a recommendation to buy, sell or hold any security or commodity. This material does not and is not intended to take into account the particular financial conditions, investment objectives or requirements of individual customers. Before acting on this material, you should consider whether it is suitable for your particular circumstances and, as necessary, seek professional advice.


Join The Conversation
If you have a general question, it may already be covered in our FAQs. If you have an account-specific question or concern, please reach out to Client Services.