


KEY TAKEAWAYS
- Value investing targets companies that are low in price when compared to their peers.
- Value investing is supported by economic theory and empirical data and can now be easily accessed through low-cost ETFs.
- Value strategies use a combination of metrics such as Price to Book (P/B), Forward Price to Earnings (P/E), and Enterprise Value to Cash Flow from Operations (EV/CFO) to identify companies that look inexpensive relative to their fundamentals.
WHAT IS VALUE INVESTING?
Value investing is a strategy that targets stocks that are low in price relative to their fundamentals and peers. The concept of value investing has been around for decades. In fact, Columbia University professors Benjamin Graham and David Dodd noted in their 1934 book, Security Analysis, that investors should focus on purchasing securities at prices less than their “true” value.1
Imagine it’s the end of October and you still haven’t purchased your costume for Halloween. While we all like to think of ourselves as outstanding planners, many people find themselves scrambling to find a costume the week of Halloween. The trip to the store is nerve-wracking – with limited options and sky-high prices almost a guarantee. A few days later, starting November 1, those same costumes are typically offered on clearance. A savvy individual could purchase these discounted costumes, hold onto them until next October, and then make a tidy profit selling them at their original price points.
Like these savvy costume hunters, value investors are looking for companies “on sale.”
HOW DO WE DEFINE VALUE INVESTING?
BlackRock takes a multiple metric approach when proxying for value. Specifically, we look at a stock’s price relative to its book value and forward earnings, as well as its enterprise value relative to cash flows generated from operations. Utilizing a single metric to identify value securities may result in the addition of error through accounting noise. By incorporating multiple metrics focused on different areas of a company’s valuation, we can reduce the noise and feel more confident we may find a stock that is truly undervalued.
| Metric | Objective |
|---|---|
| Price-to-book | Identify Undervalued Stocks |
| Forward price-to-earnings | Find undervalued stocks with strong earnings on a forward-looking basis |
| Enterprise value to cash flow from operations | Evaluate stocks using a holistic company view (equity and debt) |
Source: BlackRock, MSCI
Let’s review each of these three metrics.
Price-to-Book (P/B) takes the price of a single share of stock divided by the company’s book value per share. This metric shows what the market is willing to pay for a single share of a company relative to its assets minus its liabilities. A higher price-to-book ratio relative to peers may indicate that a stock is expensive and should have a lower expected return. On the flipside, a lower relative price-to-book ratio may indicate that the stock is “cheap” and should have a higher expected return. Much of the academic literature on value investing uses P/B as its proxy for value as the metric is consistently available and the denominator, book value, tends to be relatively stable over time.2
Forward-Price-to-Earnings (P/E) looks at the price per share of a stock compared to the 12-month forward earnings expectations of that stock. This metric seeks to evaluate the relative attractiveness of a company on a forward-looking basis. If two companies have the same stock price, but one has higher expected future earnings, the company with the lower forward P/E (higher denominator) may be considered inexpensive and should have the potential for higher future returns. One benefit of using a forward-looking metric in addition to P/B, is that it may help identify “value traps.” A value trap is a stock that is priced cheap for a reason.
Enterprise Value to Cash Flow from Operations (EV/CFO) is an additional metric that provides a differentiated view of a company. Enterprise Value looks at the entire firm, not just equity, by adding a company’s total debt to its market value and then subtracting out its cash. Cash generated from the core business of a company (CFO) tends to be more sustainable than earnings generated from other business activities.
Depending on the metric used to evaluate a company’s value characteristics, an investor can have a significantly different experience. As shown in the chart below, there has been a wide dispersion in returns between different metrics.
Dispersion in returns between sector metrics
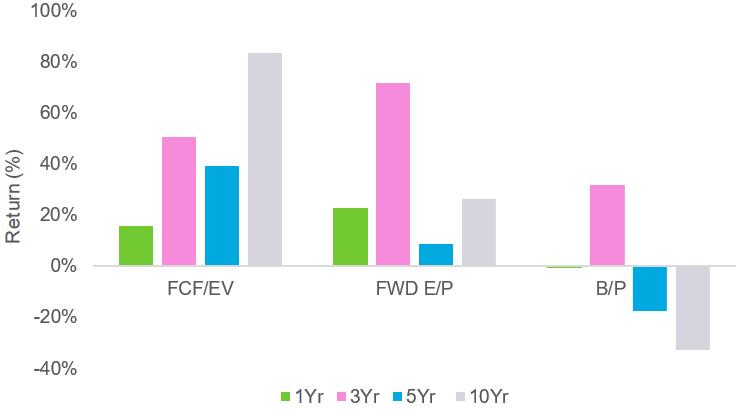
Source: Bloomberg as of 03/31/2023. Net long-short return of equal weighted stocks in Quintile 1/ Quintile 5. Values are negative if bottom 20% (Q5) outperforms top 20% (Q1). Starting Universe is all US Equities as defined by Bloomberg. FCF/ EV stands for Free Cash Flow to Enterprise Value. FWD E/P stands for Forward Earnings to Price. B/P stands for Book to Price. Index performance is for illustrative purposes only. Index performance does not reflect any management fees, transaction costs or expenses. Indexes are unmanaged and one cannot invest directly in an index. Past performance does not guarantee future results.
Chart description: Bar chart showing the returns of common value metrics over different period. Data has been compiled from Bloomberg as of 03/31/2023. FCF/EV represent Free Cash Flow over Enterprise Value. FWD E/P represents forward earnings over the market price of the security. B/P Represents Book to Price.
While we do not have a crystal ball to predict which metric will best capture value going forward, we think a combination of both backward- and forward-looking metrics may make sense. By using several metrics, we seek to maintain a more consistent exposure to the value factor.
VALUE PORTFOLIO CONSTRUCTION
When seeking to capture value, investors may want to be mindful of how much value exposure they want in their total portfolio, and how the value portfolio is constructed.
Value indexes such as the MSCI USA Enhanced Value Index and Russell 1000 Value Index have stronger exposure to the value factor as shown by their lower relative valuation ratios compared to the market.3
Valuation metrics
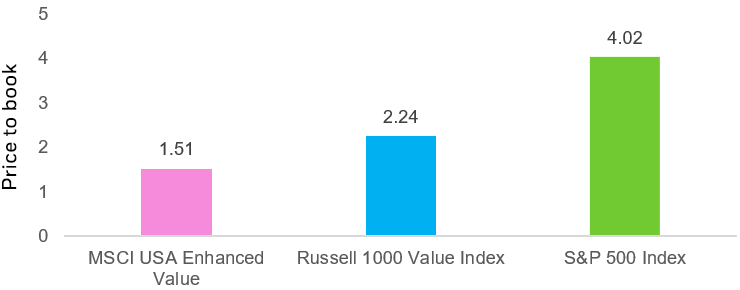
Source: Morningstar Direct as of 6/30/23. Indexes are unmanaged and one cannot invest directly in an index. Past performance does not guarantee future results.
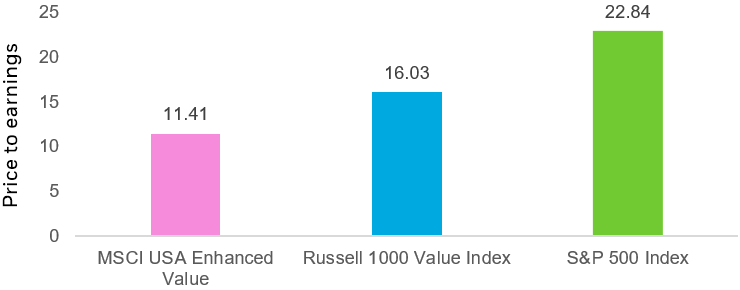
Source: Morningstar Direct as of 6/30/23. Indexes are unmanaged and one cannot invest directly in an index. Past performance does not guarantee future results.
Chart description: Bar charts showing the current standing of specific value metrics on common benchmark and the MSCI USA Enhanced Value Factor Index.
VALUE CHARACTERISTICS
As shown in the chart above, the MSCI USA Enhanced Value Index has experienced lower relative price valuation ratios than the Russell 1000 Value Index. In practice, an index with lower relative price valuations has the potential to outperform a broad based value index when value stocks do well. Conversely, indexes that have additional exposure to value will tend to underperform during challenging periods.
Another consideration for investors to be aware of is underlying sector exposures. Some sectors are prone to look structurally cheaper than others. A portfolio that simply buys the cheapest securities without considering sector allocations may have unintended sector bets. Historically, static overweight exposures to sectors have not exhibited significant long-term excess returns above the market.4 Additionally, it may be prudent to compare companies versus peers within their sector to have an “apples to apples” comparison.
We believe sector risk is an element we can control, and that it makes sense to limit deviations. We want to find value within each sector.
The MSCI USA Enhanced Value Index applies a sector neutral constraint to its parent index at each rebalance, as well as scoring companies relative to their peers in the same sector.
Sector Allocation (%)
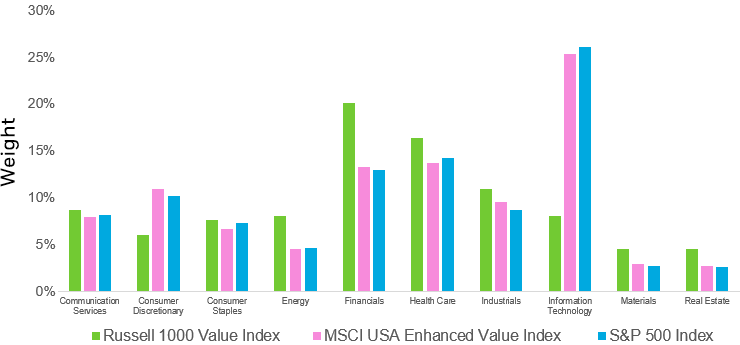
Source: Morningstar Direct as of 3/31/23. Allocations subject to change. Indexes are unmanaged and one cannot invest directly in an index. Past performance does not guarantee future results.
Chart description: Bar chart that compares the sector allocations between the S&P 500 Index, the MSCI USA Enhanced Value Index, and Russell 1000 Value Index as of 3/31/23.
It’s important for investors to understand where they may be taking risk in their portfolio. If an investor does not want to take unrewarded sector risks, it may be prudent to constrain sectors within a value strategy.
WHY DOES VALUE EXIST AND WHY DO WE EXPECT IT TO PERSIST?
Value, like all factors we believe in, has an economic rationale for why it has existed historically and why we expect it to persist going forward. Value is the result of a reward for bearing risk that other investors are not willing to take (value companies can be riskier than their counterparts). Value companies have been shown to trade at a larger discount than their growth-focused peers. Further, value exists to due to investor behavioral biases such as overpaying for past growth.5
Value factor strategies specifically focus on identifying companies that may be undervalued. All else equal, if two companies generate the same profits or the same book value, we prefer to buy the one that is less expensive. The company that has the lower valuation has higher expected returns.
CONCLUSION
Previously, investment managers used teams of analysts to identify undervalued securities in an attempt to outperform their peers. Advances in technology have given investors additional ways to systematically identify stocks that appear undervalued.
Accessing value through a low-cost, tax-efficient ETF allows investors to gain exposure to a diversified portfolio of stocks that look strong on multiple value metrics — leverage, valuations and earnings — and without unintended sector bets.
There can be no assurance that performance will be enhanced or risk will be reduced for funds that seek to provide exposure to certain quantitative investment characteristics (“factors”). Exposure to such investment factors may detract from performance in some market environments, perhaps for extended periods. In such circumstances, a fund may seek to maintain exposure to the targeted investment factors and not adjust to target different factors, which could result in losses.
—
Originally Posted August 16, 2023 – What is value investing?
© 2023 BlackRock, Inc. All rights reserved.
1 “Security Analysis” by Benjamin Graham and David Dodd, 1934.
2 Fama, Eugene F & French, Kenneth R, 1992. “The Cross-Section of Expected Stock Returns”, Journal of Finance, American Finance Association, vol. 47(2), pages 427-465, June, 1992.
3 Market represented by S&P 500 Index.
4 Fama and French, 1997, “Industry Costs of Equity”, Journal of Financial Economics, vol. 43(2), pages 153-193.
5 Fama, Eugene F & French, Kenneth R, 1992. “The Cross-Section of Expected Stock Returns”, Journal of Finance, American Finance Association, vol. 47(2), pages 427-465, June, 1992.
Carefully consider the Funds’ investment objectives, risk factors, and charges and expenses before investing. This and other information can be found in the Funds’ prospectuses or, if available, the summary prospectuses, which may be obtained by visiting the iShares Fund and BlackRock Fund prospectus pages. Read the prospectus carefully before investing.
Investing involves risk, including possible loss of principal.
International investing involves risks, including risks related to foreign currency, limited liquidity, less government regulation and the possibility of substantial volatility due to adverse political, economic or other developments. These risks often are heightened for investments in emerging/ developing markets or in concentrations of single countries.
Fixed income risks include interest-rate and credit risk. Typically, when interest rates rise, there is a corresponding decline in the value of debt securities. Credit risk refers to the possibility that the debt issuer will not be able to make principal and interest payments.
This material represents an assessment of the market environment as of the date indicated; is subject to change; and is not intended to be a forecast of future events or a guarantee of future results. This information should not be relied upon by the reader as research or investment advice regarding the funds or any issuer or security in particular.
Buying and selling shares of ETFs may result in brokerage commissions.
The strategies discussed are strictly for illustrative and educational purposes and are not a recommendation, offer or solicitation to buy or sell any securities or to adopt any investment strategy. There is no guarantee that any strategies discussed will be effective.
The information presented does not take into consideration commissions, tax implications, or other transactions costs, which may significantly affect the economic consequences of a given strategy or investment decision.
Diversification and asset allocation may not protect against market risk or loss of principal.
There can be no assurance that performance will be enhanced or risk will be reduced for funds that seek to provide exposure to certain quantitative investment characteristics (“factors”). Exposure to such investment factors may detract from performance in some market environments, perhaps for extended periods. In such circumstances, a fund may seek to maintain exposure to the targeted investment factors and not adjust to target different factors, which could result in losses.
The iShares Minimum Volatility Funds may experience more than minimum volatility as there is no guarantee that the underlying index’s strategy of seeking to lower volatility will be successful.
Commodities’ prices may be highly volatile. Prices may be affected by various economic, financial, social and political factors, which may be unpredictable and may have a significant impact on the prices of commodities.
This material contains general information only and does not take into account an individual’s financial circumstances. This information should not be relied upon as a primary basis for an investment decision. Rather, an assessment should be made as to whether the information is appropriate in individual circumstances and consideration should be given to talking to a financial professional before making an investment decision.
The Funds are distributed by BlackRock Investments, LLC (together with its affiliates, “BlackRock”).
The iShares Funds are not sponsored, endorsed, issued, sold or promoted by Bloomberg, BlackRock Index Services, LLC, Cboe Global Indices, LLC, Cohen & Steers, European Public Real Estate Association (“EPRA® ”), FTSE International Limited (“FTSE”), ICE Data Indices, LLC, NSE Indices Ltd, JPMorgan, JPX Group, London Stock Exchange Group (“LSEG”), MSCI Inc., Markit Indices Limited, Morningstar, Inc., Nasdaq, Inc., National Association of Real Estate Investment Trusts (“NAREIT”), Nikkei, Inc., Russell, S&P Dow Jones Indices LLC or STOXX Ltd. None of these companies make any representation regarding the advisability of investing in the Funds. With the exception of BlackRock Index Services, LLC, who is an affiliate, BlackRock Investments, LLC is not affiliated with the companies listed above.
Neither FTSE, LSEG, nor NAREIT makes any warranty regarding the FTSE Nareit Equity REITS Index, FTSE Nareit All Residential Capped Index or FTSE Nareit All Mortgage Capped Index. Neither FTSE, EPRA, LSEG, nor NAREIT makes any warranty regarding the FTSE EPRA Nareit Developed ex-U.S. Index, FTSE EPRA Nareit Developed Green Target Index or FTSE EPRA Nareit Global REITs Index. “FTSE®” is a trademark of London Stock Exchange Group companies and is used by FTSE under license.
©2023 BlackRock, Inc or its affiliates. All Rights Reserved. BLACKROCK, iSHARES, iBONDS, ALADDIN and the iShares Core Graphic are trademarks of BlackRock, Inc. or its affiliates. All other trademarks are those of their respective owners.
iCRMH0823U/S-3000843
Disclosure: iShares by BlackRock
The iShares Funds are distributed by BlackRock Investments, LLC (together with its affiliates, “BlackRock”).
The iShares Funds are not sponsored, endorsed, issued, sold or promoted by Markit Indices Limited, nor does this company make any representation regarding the advisability of investing in the Funds. BlackRock is not affiliated with Markit Indices Limited.
©2022 BlackRock, Inc. All rights reserved. iSHARES and BLACKROCK are registered trademarks of BlackRock, Inc., or its subsidiaries in the United States and elsewhere. All other marks are the property of their respective owners.
Disclosure: Interactive Brokers
Information posted on IBKR Campus that is provided by third-parties does NOT constitute a recommendation that you should contract for the services of that third party. Third-party participants who contribute to IBKR Campus are independent of Interactive Brokers and Interactive Brokers does not make any representations or warranties concerning the services offered, their past or future performance, or the accuracy of the information provided by the third party. Past performance is no guarantee of future results.
This material is from iShares by BlackRock and is being posted with its permission. The views expressed in this material are solely those of the author and/or iShares by BlackRock and Interactive Brokers is not endorsing or recommending any investment or trading discussed in the material. This material is not and should not be construed as an offer to buy or sell any security. It should not be construed as research or investment advice or a recommendation to buy, sell or hold any security or commodity. This material does not and is not intended to take into account the particular financial conditions, investment objectives or requirements of individual customers. Before acting on this material, you should consider whether it is suitable for your particular circumstances and, as necessary, seek professional advice.
Disclosure: ETFs
Any discussion or mention of an ETF is not to be construed as recommendation, promotion or solicitation. All investors should review and consider associated investment risks, charges and expenses of the investment company or fund prior to investing. Before acting on this material, you should consider whether it is suitable for your particular circumstances and, as necessary, seek professional advice.


Join The Conversation
If you have a general question, it may already be covered in our FAQs. If you have an account-specific question or concern, please reach out to Client Services.