


- Momentum and Minimum Volatility factors have underperformed the market by the most out of any other factor in 2023.
- Excess return correlations for Momentum and Minimum Volatility factors spiked this year, deviating from historical low to negative correlations.
- Strategy design, rebalancing frequency, and prior-year market trends are the likely causes of the increased correlation.
Momentum stocks are typically viewed as higher risk assets that behave differently than lower risk Minimum Volatility exposures. But this year, Momentum and Minimum Volatility are the only ones across the traditional four factors trailing the market by double digits.1 With only a 3% and 5% gain in 2023, they are down 17% and 14%, respectively.2
As a result, their correlation of excess returns has spiked to an average 71% for all of 2023.3 This compares to a historical excess return correlation of just 9.6%,4 putting this year’s behavior at odds with historical trends and the generalized views of factor frameworks.
Will this correlation continue into 2024?
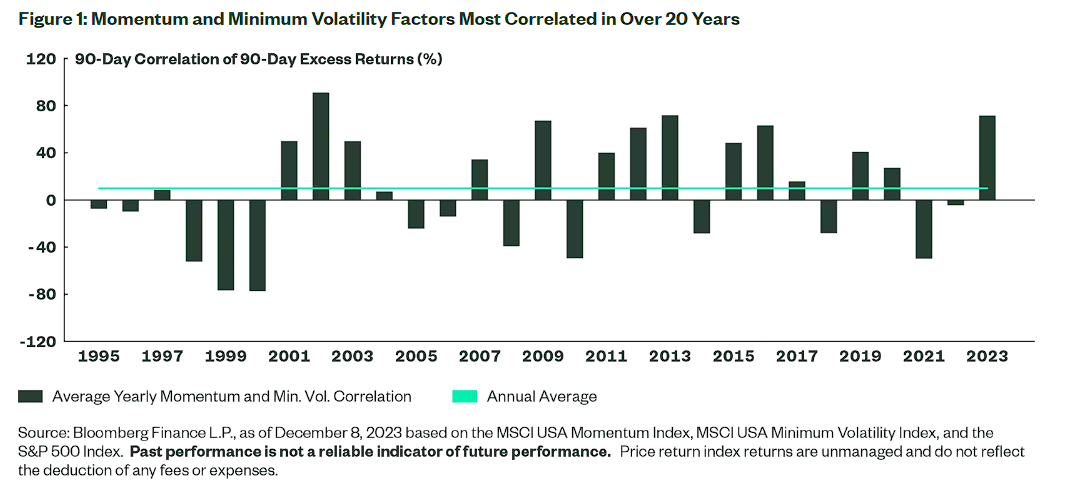
Momentum and Minimum Volatility Most Correlated Since 2002
The basic premise of factor investing is that certain factors (Value, Momentum, Quality, and Minimum Volatility) represent premia that can add to returns over a long-term horizon. Yet, cyclical shifts can impact short-term returns, leading to periods of underperformance versus the market.
Factor investing also provides potential diversification opportunities. But when return trends break down as a result of cyclical market shifts, so do the potential diversification benefits. That’s happening now with Momentum and Minimum Volatility exposures.
Using rolling 90-day correlation of 90-day excess returns to the S&P 500 Index (removing outliers and general market beta from two long-only exposures), Momentum and Minimum Volatility stocks have not been this correlated in a calendar year since 2002. The average correlation in 2023 has been 71%, compared to long-term average 9.6% (Figure 1).
The Impact of Factor Construction
Factor construction (e.g., market neutral, beta neutral, long-only, sector neutral, high capacity versus high concentration) alongside attribute selection (e.g., price-to-book versus price-to-sales for value investors) can lead to different profiles, returns, and relationships to other factors. Yet, the same trend for Momentum and Minimum volatility factors exists even if different construction methodologies are used.
The above MSCI-based Momentum and Minimum Volatility exposures are rebalanced semi-annually and use different descriptors for the intended factor focuses than what the S&P 500 USA Momentum Index and the S&P 500 Low Volatility Index use. The latter of which also rebalances annually.
For those two S&P based factor types, the 2023 average correlation is also 71% versus a long-term average of -2%.5 Point being, the factors’ co-movement is consistent across other factor frameworks.
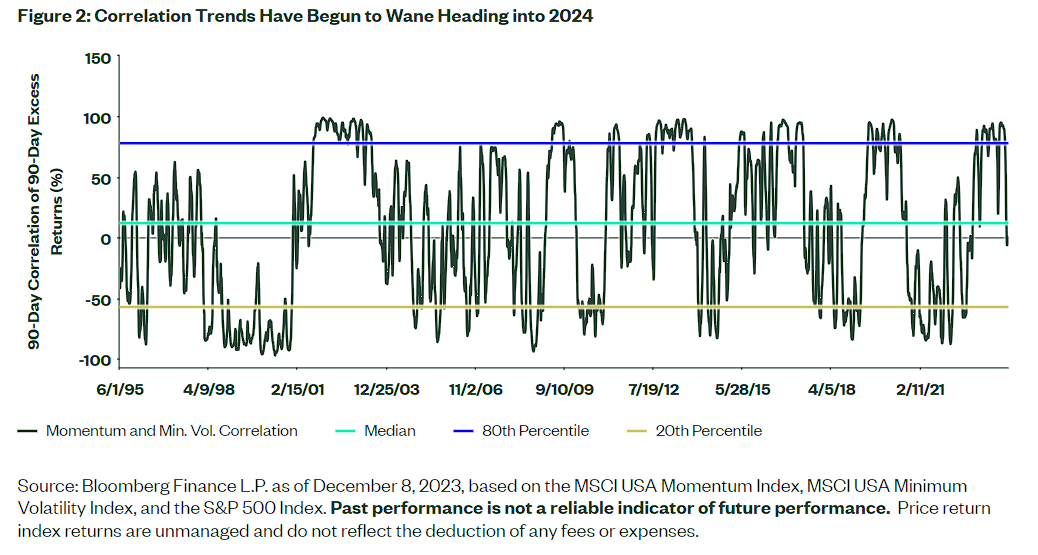
But the co-movement has begun to rollover and mean revert. The rolling 90-day correlation of 90-day excess returns has declined in the last few weeks and is now below the historical median (Figure 2). The same trend exists if we use the S&P-based factors.
Click here to read the full article
—
What’s the Increased Correlation Between Momentum and Minimum Volatility Mean?
Footnotes
1 Value, Quality, Momentum, and Minimum Volatility.
2 Bloomberg Finance L.P. as of December 11, 2023, based on the S&P 500 Index, MSCI USA Minimum Volatility Index and the MSCI USA Momentum Index.
3 Bloomberg Finance L.P. as of December 11, 2023, based on the S&P 500 Index, MSCI USA Minimum Volatility Index and the MSCI USA Momentum Index 90-day rolling 90-day excess return correlations.
4 Bloomberg Finance L.P. as of December 11, 2023, based on the S&P 500 Index, MSCI USA Minimum Volatility Index and the MSCI USA Momentum Index 90-day rolling 90-day excess return correlations.
5 Bloomberg Finance L.P. as of December 11, 2023, based on the S&P 500 Index, S&P 500 USA Momentum Index and the S&P 500 Low Volatility Index 90-day rolling 90-day excess return correlations.
6 Bloomberg Finance L.P. as of December 11, 2023, based on the MSCI USA Minimum Volatility Index and the MSCI USA Momentum Index annual holdings from 2013-2023.
Glossary
S&P 500 Index
The S&P 500® Index is designed to measure the performance of the large-cap segment of the US equity market. It is float-adjusted market capitalization weighted.
S&P 500® Momentum
S&P 500® Momentum is designed to measure the performance of securities in the S&P 500 universe that exhibit persistence in their relative performance.
S&P 500® Low Volatility Index
This S&P 500® Low Volatility Index consists of the 100 stocks from the S&P 500 Index with the lowest realized volatility over the past 12 months.
MSCI USA Minimum Volatility Index
MSCI USA Minimum Volatility Index is designed to reflect the performance of a minimum variance (or managed volatility) equity strategy.
MSCI USA Momentum Index
MSCI USA Momentum Index is composed of U.S. large- and mid-capitalization stocks exhibiting relatively higher price momentum.
Value
Value investing is an investment strategy that involves picking stocks that appear to be trading for less than their intrinsic or book value.
Momentum
Momentum investing involves going long on stocks, futures, market exchange-traded funds (ETFs), or any financial instrument showing upward-trending prices.
Minimum volatility
Minimum volatility investing seeks to build a portfolio of stocks that exhibits less variability than the broad market. It aims to provide investors with a smoother ride within equity allocations by creating a portfolio that exhibits less swings — up or down — than the market.
Quality
The quality factor refers to the tendency of high-quality stocks with typically more stable earnings, stronger balance sheets and higher margins to outperform low-quality stocks, over a long-time horizon.
Correlation of Excess Returns
Applying the same methodology as with a standard correlation coefficient calculation, the correlation of excess returns attempts to indicate linearity in the movement of returns above a given benchmark.
Disclosure
The views expressed in this material are the views of the SPDR Research and Strategy team through the period ended December 11, 2023, and are subject to change based on market and other conditions. This document contains certain statements that may be deemed forward-looking statements. Please note that any such statements are not guarantees of any future performance and actual results or developments may differ materially from those projected.
The information provided does not constitute investment advice and it should not be relied on as such. It should not be considered a solicitation to buy or an offer to sell a security. It does not take into account any investor’s particular investment objectives, strategies, tax status or investment horizon. You should consult your tax and financial advisor.
Unless otherwise noted, all data and statistical information were obtained from Bloomberg Finance, L.P. and SSGA as of December 11, 2023. Data in tables have been rounded to whole numbers, except for percentages, which have been rounded to the nearest tenth of a percent.
All information is from SSGA unless otherwise noted and has been obtained from sources believed to be reliable, but its accuracy is not guaranteed. There is no representation or warranty as to the current accuracy, reliability or completeness of, nor liability for, decisions based on such information, and it should not be relied on as such.
Investing involves risk including the risk of loss of principal.
Equity securities may fluctuate in value and can decline significantly in response to the activities of individual companies and general market and economic conditions.
Because of their narrow focus, sector investing tends to be more volatile than investments that diversify across many sectors and companies.
The whole or any part of this work may not be reproduced, copied or transmitted or any of its contents disclosed to third parties without SSGA’s express written consent.
Disclosure: State Street Global Advisors
Do not reproduce or reprint without the written permission of SSGA.
All information has been obtained from sources believed to be reliable, but its accuracy is not guaranteed. There is no representation or warranty as to the current accuracy, reliability or completeness of, nor liability for, decisions based on such information and it should not be relied on as such.
State Street Global Advisors and its affiliates (“SSGA”) have not taken into consideration the circumstances of any particular investor in producing this material and are not making an investment recommendation or acting in fiduciary capacity in connection with the provision of the information contained herein.
ETFs trade like stocks, are subject to investment risk, fluctuate in market value and may trade at prices above or below the ETF’s net asset value. Brokerage commissions and ETF expenses will reduce returns.
Bonds generally present less short-term risk and volatility than stocks, but contain interest rate risk (as interest rates raise, bond prices usually fall); issuer default risk; issuer credit risk; liquidity risk; and inflation risk. These effects are usually pronounced for longer-term securities. Any fixed income security sold or redeemed prior to maturity may be subject to a substantial gain or loss.
Investing involves risk including the risk of loss of principal.
The whole or any part of this work may not be reproduced, copied or transmitted or any of its contents disclosed to third parties without SSGA’s express written consent.
Investing in high yield fixed income securities, otherwise known as “junk bonds”, is considered speculative and involves greater risk of loss of principal and interest than investing in investment grade fixed income securities. These Lower-quality debt securities involve greater risk of default or price changes due to potential changes in the credit quality of the issuer.
COPYRIGHT AND OTHER RIGHTS
Other third party content is the intellectual property of the respective third party and all rights are reserved to them. All rights reserved. No organization or individual is permitted to reproduce, distribute or otherwise use the statistics and information in this report without the written agreement of the copyright owners.
Definition:
Arbitrage: the simultaneous buying and selling of securities, currency, or commodities in different markets or in derivative forms in order to take advantage of differing prices for the same asset.
Fund Objectives:
SPY: The investment seeks to provide investment results that, before expenses, correspond generally to the price and yield performance of the S&P 500® Index. The Trust seeks to achieve its investment objective by holding a portfolio of the common stocks that are included in the index (the “Portfolio”), with the weight of each stock in the Portfolio substantially corresponding to the weight of such stock in the index.
VOO: The investment seeks to track the performance of a benchmark index that measures the investment return of large-capitalization stocks. The fund employs an indexing investment approach designed to track the performance of the Standard & Poor’s 500 Index, a widely recognized benchmark of U.S. stock market performance that is dominated by the stocks of large U.S. companies. The advisor attempts to replicate the target index by investing all, or substantially all, of its assets in the stocks that make up the index, holding each stock in approximately the same proportion as its weighting in the index.
IVV: The investment seeks to track the investment results of the S&P 500 (the “underlying index”), which measures the performance of the large-capitalization sector of the U.S. equity market. The fund generally invests at least 90% of its assets in securities of the underlying index and in depositary receipts representing securities of the underlying index. It may invest the remainder of its assets in certain futures, options and swap contracts, cash and cash equivalents, as well as in securities not included in the underlying index, but which the advisor believes will help the fund track the underlying index.
The funds presented herein have different investment objectives, costs and expenses. Each fund is managed by a different investment firm, and the performance of each fund will necessarily depend on the ability of their respective managers to select portfolio investments. These differences, among others, may result in significant disparity in the funds’ portfolio assets and performance. For further information on the funds, please review their respective prospectuses.
Entity Disclosures:
The trademarks and service marks referenced herein are the property of their respective owners. Third party data providers make no warranties or representations of any kind relating to the accuracy, completeness or timeliness of the data and have no liability for damages of any kind relating to the use of such data.
SSGA Funds Management, Inc. serves as the investment advisor to the SPDR ETFs that are registered with the United States Securities and Exchange Commission under the Investment Company Act of 1940. SSGA Funds Management, Inc. is an affiliate of State Street Global Advisors Limited.
Intellectual Property Disclosures:
Standard & Poor’s®, S&P® and SPDR® are registered trademarks of Standard & Poor’s® Financial Services LLC (S&P); Dow Jones is a registered trademark of Dow Jones Trademark Holdings LLC (Dow Jones); and these trademarks have been licensed for use by S&P Dow Jones Indices LLC (SPDJI) and sublicensed for certain purposes by State Street Corporation. State Street Corporation’s financial products are not sponsored, endorsed, sold or promoted by SPDJI, Dow Jones, S&P, their respective affiliates and third party licensors and none of such parties make any representation regarding the advisability of investing in such product(s) nor do they have any liability in relation thereto, including for any errors, omissions, or interruptions of any index.
BLOOMBERG®, a trademark and service mark of Bloomberg Finance, L.P. and its affiliates, and BARCLAYS®, a trademark and service mark of Barclays Bank Plc., have each been licensed for use in connection with the listing and trading of the SPDR Bloomberg Barclays ETFs.
Distributor: State Street Global Advisors Funds Distributors, LLC, member FINRA, SIPC, an indirect wholly owned subsidiary of State Street Corporation. References to State Street may include State Street Corporation and its affiliates. Certain State Street affiliates provide services and receive fees from the SPDR ETFs.
ALPS Distributors, Inc., member FINRA, is distributor for SPDR® S&P 500®, SPDR® S&P MidCap 400® and SPDR® Dow Jones Industrial Average, all unit investment trusts. ALPS Distributors, Inc. is not affiliated with State Street Global Advisors Funds Distributors, LLC.
Before investing, consider the funds’ investment objectives, risks, charges, and expenses. For SPDR funds, you may obtain a prospectus or summary prospectus containing this and other information by calling 1‐866‐787‐2257 or visiting www.spdrs.com. Please read the prospectus carefully before investing.
Disclosure: Interactive Brokers
Information posted on IBKR Campus that is provided by third-parties does NOT constitute a recommendation that you should contract for the services of that third party. Third-party participants who contribute to IBKR Campus are independent of Interactive Brokers and Interactive Brokers does not make any representations or warranties concerning the services offered, their past or future performance, or the accuracy of the information provided by the third party. Past performance is no guarantee of future results.
This material is from State Street Global Advisors and is being posted with its permission. The views expressed in this material are solely those of the author and/or State Street Global Advisors and Interactive Brokers is not endorsing or recommending any investment or trading discussed in the material. This material is not and should not be construed as an offer to buy or sell any security. It should not be construed as research or investment advice or a recommendation to buy, sell or hold any security or commodity. This material does not and is not intended to take into account the particular financial conditions, investment objectives or requirements of individual customers. Before acting on this material, you should consider whether it is suitable for your particular circumstances and, as necessary, seek professional advice.


Join The Conversation
If you have a general question, it may already be covered in our FAQs. If you have an account-specific question or concern, please reach out to Client Services.