


For a change, broad market indices took a breather yesterday. Despite the modest dips in the S&P 500 (SPX) and NASDAQ 100 (NDX) indices, the Russell 2000 (RTY[i]) was up 1.75%. That led to numerous questions about a resurgence in small cap stocks. Today, however, with stocks of all types taking a bit more than a breather, RTY is severely underperforming. What is the real story here?
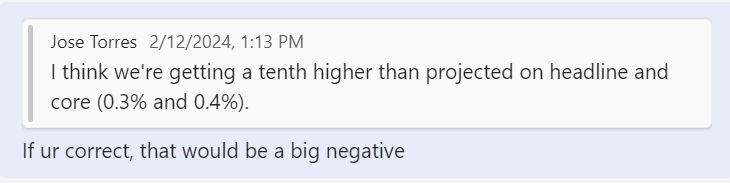
As you likely know by now, stocks are plunging and bond yields are rising after an unexpected rise in the Consumer Price Index this morning. Month-over-month headline and Core CPI rose 0.3% and 0.4% respectively; both were 0.1% above consensus expectations. That said, a shout-out is due for my colleague Jose Torres, our senior economist, for this exchange via our firm’s Teams chat yesterday:
Thus, as I type this about 75 minutes after the market’s open, we have SPX down -1.2% while RTY has given back all yesterday’s gains and then some, down -3.3%. (NDX is slightly outperforming at -1.1%, thanks to Nvidia (NVDA) recovering from a -3% loss to rally 1% so far.[ii])
The key question for investors considering an investment in small-cap stocks is whether:
- there is a sensible thesis for outperformance,
- a lasting rotation thanks to a broadening equity market rally, or
- simply a more volatile companion to more highly capitalized stocks.
The last part is apparent when we compare the historical volatilities of SPX and RTY. The latter is nearly double the former, with the 30-day historical volatility for Russell showing 1.18% while SPX shows 0.6%:
30-Day Historical (red) and Implied (white) Volatilities for Russell 2000 (left) and SPX (right)
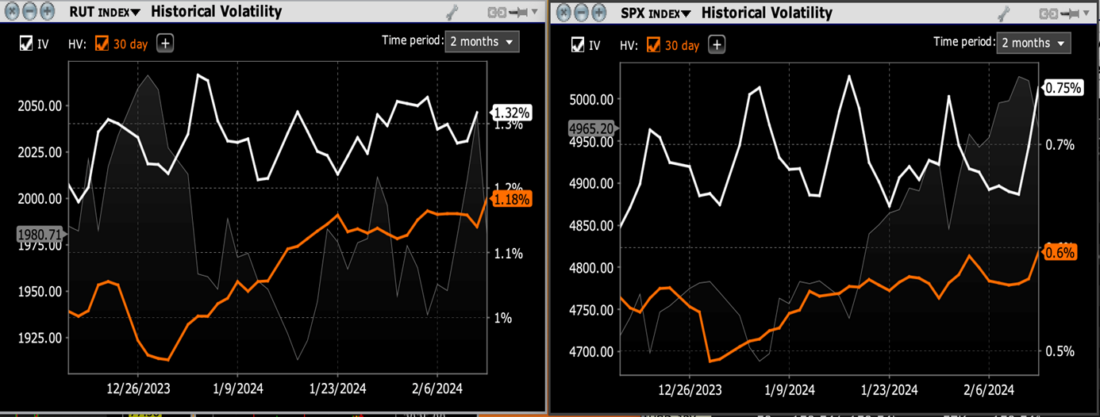
Source: Interactive Brokers
It would be hypocritical of me to suggest that volatility is undesirable for a trading instrument, but it needs to be an important consideration for an investor. Volatility offers more profit opportunities to short-term traders, but from a long-term perspective, if two investments offer similar returns but with disparate volatility, one should prefer the lower-volatility alternative. Thus, we need to decide whether the buying that we see is better characterized as opportunistic rotation into a lagging market sector or an overdue chance to purchase an undervalued group of stocks.
There is a solid rationale for RTY trading roughly 20% its 2021 all-time high while SPX is perched just below a record. Many of the Russell 2000’s constituents are unprofitable. To some this is a feature, because it means that there is greater operating leverage if those companies can turn around their bottom lines, but it also means that these companies lack the pricing power that industry leaders possess. The high number of unprofitable companies results in RTY having a higher P/E than SPX (28 vs. 24). Pricing power, which offers stable revenues and earnings, has been a key investment thesis that has driven a host of major stocks’ performance – not least of which include the Magnificent 7.
5-Year Chart, Russell 2000 (white) vs SPX (blue)
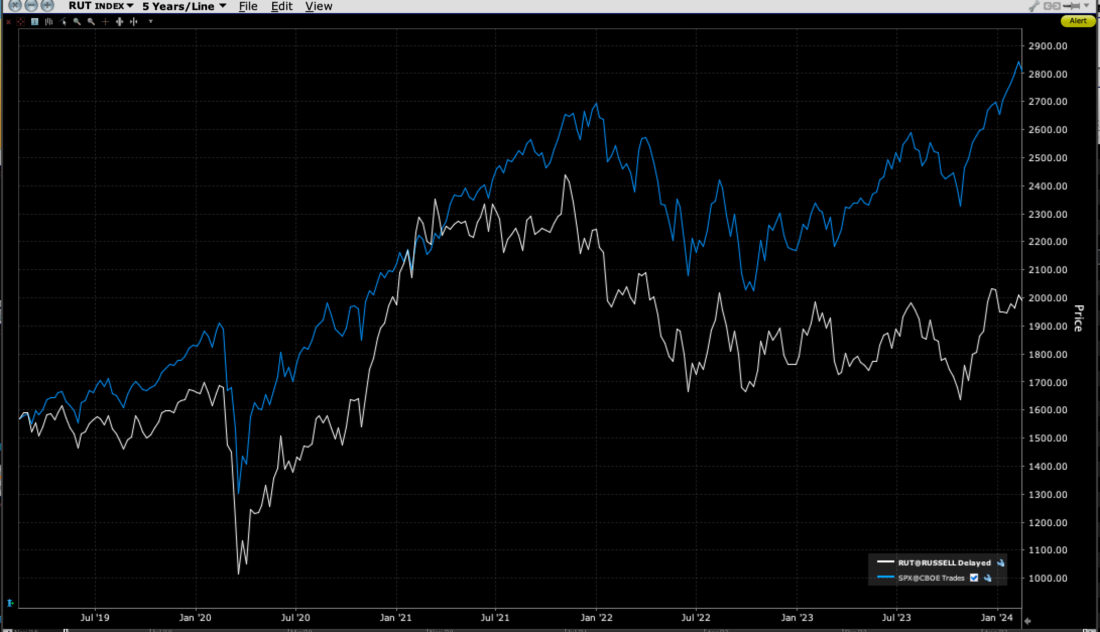
Source: Interactive Brokers
Unfortunately, one of two things need to go right for small cap outperformance, and neither factor is clearly in the picture right now. They either need a strong enough economy to lift their prospects for profitability or low interest rates that will enable them to continue financing their operations favorably. It is unclear whether the anticipated soft landing will be robust enough to boost small companies’ bottom lines, but it is quite clear that high rates and tight credit conditions are unfavorable headwinds for these stocks. On a day when we see rates rising across the curve and rate cut assumptions being pushed out to June, it is hardly a surprise to see RTY underperform a falling SPX.
Bottom line, if we see broad markets continue to rally on a daily basis, it is inevitable that a host of traders and investors will gravitate toward a lagging set of stocks in the hope that they will catch up. We have seen several days where that sort of rotation occurs, which is profitable for those who successfully catch the waves. But unless we see more signs of either a stronger than expected economy or easing credit conditions, the Russell 2000 is likely to experience headwinds that its larger peers will not.
—
[i] On the IB TWS, the symbol for the Russell 2000 Index is RUT, but futures and options on that index are under the symbol RTY. I have chosen to use the tradeable symbol.
[ii] I discussed the market risks surrounding next week’s NVDA earnings report on CNBC yesterday. I laid out much of those points in yesterday’s piece.
Disclosure: Interactive Brokers
The analysis in this material is provided for information only and is not and should not be construed as an offer to sell or the solicitation of an offer to buy any security. To the extent that this material discusses general market activity, industry or sector trends or other broad-based economic or political conditions, it should not be construed as research or investment advice. To the extent that it includes references to specific securities, commodities, currencies, or other instruments, those references do not constitute a recommendation by IBKR to buy, sell or hold such investments. This material does not and is not intended to take into account the particular financial conditions, investment objectives or requirements of individual customers. Before acting on this material, you should consider whether it is suitable for your particular circumstances and, as necessary, seek professional advice.
The views and opinions expressed herein are those of the author and do not necessarily reflect the views of Interactive Brokers, its affiliates, or its employees.


Join The Conversation
If you have a general question, it may already be covered in our FAQs. If you have an account-specific question or concern, please reach out to Client Services.