


Reversal Bar Patterns Part 3: Buying and Selling Climaxes by CMT_Association on TradingView.com
In parts one and two (linked) we covered the basics of reversal bar patterns including hooks, pipes, and keys. In this piece we focus on the buying and selling climax. In the final installment we will focus on upthrusts and springs.
The patterns covered in this series represent an overt change in the balance of supply and demand. Importantly, very few patterns set up as they would in textbooks or in my examples, but the principles are consistent. Understanding why they occur and developing analysis and trading judgement around them is a primary skill. In this regard, there is no substitute for staring at thousands of bar and candle charts.
One of the more important chart patterns is the buying and selling climax (BC & SC). Climaxes are exhaustion/capitulation patterns. A selling climax (SC) develops as weak handed buyers capitulate. Buying climaxes build as shorts capitulate and timid buyers who missed out on the rally are finally induced to enter. Selling climaxes are more about existing longs capitulating and selling. In general, the complete (perfect) pattern sequence consists of preliminary demand (PD) selling climax (SC), minor test (MT), automatic rally (AR) and secondary test (ST). Of the six, the minor test and preliminary demand are optional.
For simplicity we will focus on the selling climax. Buying climaxes conditions are the direct opposite with the exception that they tend to occur on lower volume than selling climaxes.
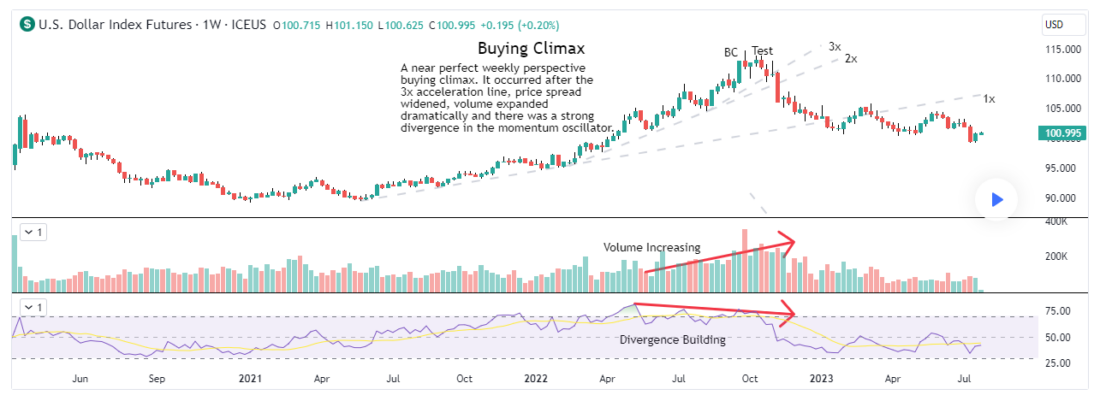
Climaxes typically occur in extremely extended markets that have trended a long while. The climax low is often made in conjunction with extremely bearish news flow, dismal sentiment, and a palatable bearishness. Put/Call ratios and other derivative measures are typically at extremes. I begin actively monitoring for the pattern when oscillators reach extreme readings or after a long period of trending behavior. I am more attentive on the second or third foray into oversold/overbought, particularly if there is a pronounced momentum divergence. The appearance of the climax strongly suggests that bad news has already been discounted.
Trends are often defined by three successively steeper trendlines. The 3rd and final trendline is often parabolic and defines the terminal portion of a trend. I am particularly attentive for the pattern to develop after the third trendline develops.
Climax structures are not created by strong handed/well informed buyers buying the weakness, but by over-levered and poorly placed longs capitulating and liquidating positions as their pain becomes too much to bear. The bearish news also lures in new weak handed/trading shorts, who, trapped by the sudden reversal, are forced to cover. The combination of the two clears the immediately available supply.
Once the immediately available supply is cleared, there is not much resistance to the market advancing. In Wyckoff terms the initial rally from the selling climax low is labeled the automatic rally (AR). As the AR develops, shares are often distributed back from strong hands to weak hands. Since supply has been exhausted, the AR can often cover significant ground. Opportunistic short-term buyers of the selling climax often use this rally to sell a large portion of the position built during the climax. Remember that the buyers during the SC are not generally long-term investors but are more likely sophisticated agile traders. They often take advantage of the reaction rally to take trading profits.
While climax behaviors often represent intermediate or long-term turning points, they can also represent shorter term exhaustion of the immediately available supply/trend. As the automatic rally develops new supply will emerge. Longs who resisted selling during the sharp decline to the climax lows, opportunistic traders who bought into the reversal behavior and new shorts all sell into this rally. Additionally, strong handed bearish fundamental traders may increase their line. This is why, for a climax to be trusted, there must be a secondary test (ST) that is well separated in time from the initial low.
In the weeks and months that follow a weekly perspective SC, the market will test near the climax low. The successful completion of the test generally represents an all clear for longer term positions.
The pattern is fractal. That is it shows in all time perspectives. The key is that the secondary test is well separated in time from the climax structure.
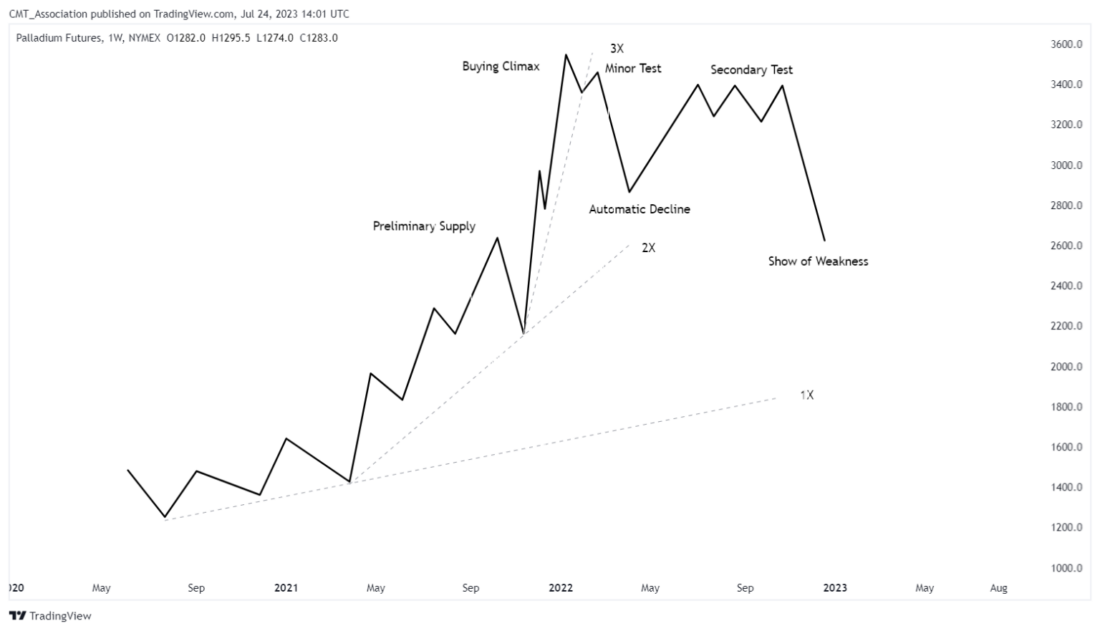
Preliminary Demand: There is often a sharp rally just prior to the selling climax. Wyckoff labeled this as preliminary demand (PD), a point at which strong handed longs are beginning to accumulate shares in anticipation of a turn. The PD is an alert to begin monitoring for a selling climax. The PD rally should be noticeably stronger than the rallies that preceded it.
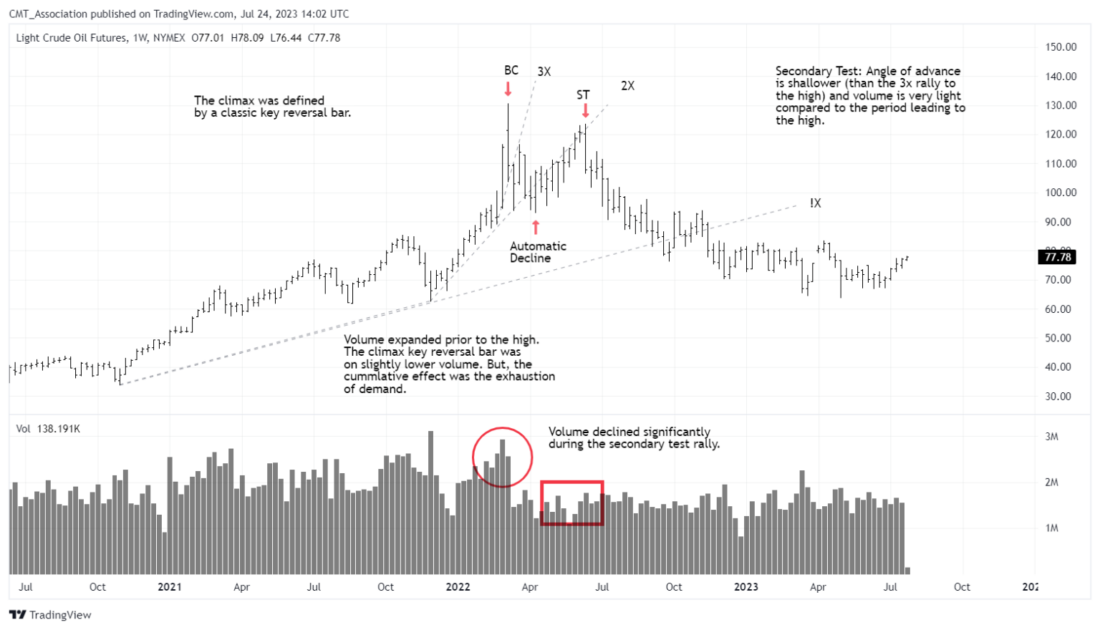
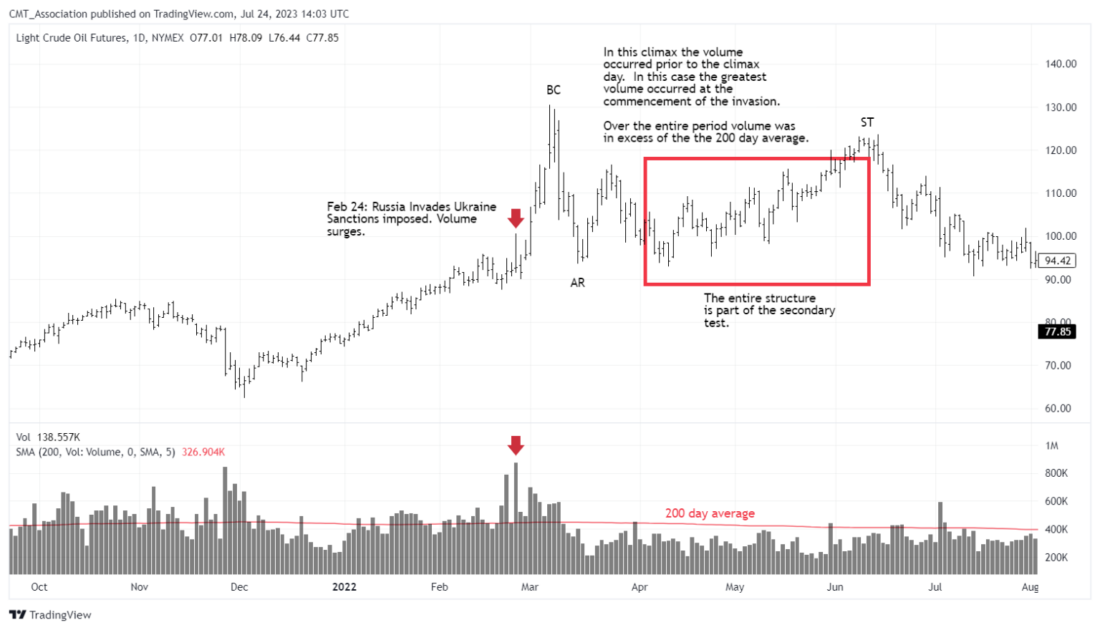
Selling Climax: Climax patterns are typified by extremely heavy volume, much wider than normal price spreads and typically feature a clear reversal pattern (often a key reversal) bar or bars. There is generally an acceleration of the trend, with wider price spreads and a steeper angle of decline. At one time climaxes were mostly single bar affairs, but now the climax structure often builds over several trading days.
Minor Test: In the hours and days after the automatic rally begins, the market will often suffer a setback toward the SC. The appearance of demand on this setback solidifies the odds that the AR rally will cover reasonable ground. In many cases the minor test will only appear on intraday charts.
Automatic Rally: In the days following the SC the market will rally sharply. Volume is typically very strong near the beginning and tails off as the rally progresses. The AR often has a noticeably different character than prior corrections in the downtrend in that they cover more ground and volume is better. Distance traveled is important, the greater the reaction after the climax the more significant its implications. Small ARs are not to be trusted.
Secondary Test: Selling climaxes clear out the immediately available supply in that price zone. Even short-term climaxes can stall the market for a period of time (think trading range). But they can fail, and when they fail rapidly it is a solid indication of a continuing bear market. This is why climax structures MUST BE SUCCESSFULLY TESTED before they represent anything other than short term capitulation.
The test should be well separated in time, and occur on generally lower volume. Selling should be far less intense than on the initial decline. This is demonstrated by the general decline in volume and the angle of the testing decline. In other words, the angle of the decline to test should be significantly less than the angle of the original decline. I prefer to see them play out over several weeks (assuming a daily perspective outlook).
Trading Range: Often the test will take the form of a trading range during which strong hands, usually large institutions, accumulate new long positions. In future installments we will cover the analysis of trading ranges.
At times the market will make a V bottom with no test. In that case, when the new trend becomes unmistakable, you should begin utilizing traditional trend-based entries into positions.
To Repeat: The huge volume and the reversal bar offer a warning that things may be changing. But, without the completed test, a trend reversal is only conjecture. YOU MUST HAVE A COMPLETED TEST before deciding that a low of any consequence has been made.
Climaxes are fractal. They appear in literally every time frame. But the larger the time perspective, the more important the climax. It is also worth noting that the notes around sentiment are not particularly meaningful when working in time frame shorter than daily.
And finally, many of the topics and techniques discussed in this post are part of the CMT Associations Chartered Market Technician’s curriculum.
—
Reversal Bar Patterns Part 3: Buying and Selling Climaxes
Shared content and posted charts are intended to be used for informational and educational purposes only. The CMT Association does not offer, and this information shall not be understood or construed as, financial advice or investment recommendations. The information provided is not a substitute for advice from an investment professional. The CMT Association does not accept liability for any financial loss or damage our audience may incur.
Disclosure: CMT Association
Shared content and posted charts are intended to be used for informational and educational purposes only. The CMT Association does not offer, and this information shall not be understood or construed as, financial advice or investment recommendations. The information provided is not a substitute for advice from an investment professional. The CMT Association does not accept liability for any financial loss or damage our audience may incur.
Disclosure: Interactive Brokers
Information posted on IBKR Campus that is provided by third-parties does NOT constitute a recommendation that you should contract for the services of that third party. Third-party participants who contribute to IBKR Campus are independent of Interactive Brokers and Interactive Brokers does not make any representations or warranties concerning the services offered, their past or future performance, or the accuracy of the information provided by the third party. Past performance is no guarantee of future results.
This material is from CMT Association and is being posted with its permission. The views expressed in this material are solely those of the author and/or CMT Association and Interactive Brokers is not endorsing or recommending any investment or trading discussed in the material. This material is not and should not be construed as an offer to buy or sell any security. It should not be construed as research or investment advice or a recommendation to buy, sell or hold any security or commodity. This material does not and is not intended to take into account the particular financial conditions, investment objectives or requirements of individual customers. Before acting on this material, you should consider whether it is suitable for your particular circumstances and, as necessary, seek professional advice.


Join The Conversation
If you have a general question, it may already be covered in our FAQs. If you have an account-specific question or concern, please reach out to Client Services.