


Last year I produced several posts that described an exercise that utilizes long term momentum changes between asset classes and the relationship among asset classes to anticipate the business cycle. That series and part 1 of this series are linked below.
Methodology: Individual markets and ratios are plotted in the quadrant that best describes their combination of momentum and price trend. The precise point where the individual plots fall in the matrix is not nearly as important as the overall pattern of multiple plot points and the weight of the evidence. The quadrants reflect the relationship between the 13 and 26 month exponentially smoothed averages.
Part one of the series described the general methodology and presented the matrix with the raw data. In this piece we consolidate the individual data points and begin to draw conclusions around the economy’s position in the current business cycle.

This is the raw data plot. Its important to remember that each asset placement in the matrix is determined by the combination of momentum state and price behavior. In other words there is a strong subjective aspect in the placement that is subject to all the normal behavioral biases. I have no doubt that the matrix would look somewhat different had someone else produced it. In my opinion, the more important takeaway is not where any individual asset falls within the matrix but where the general pattern produced by like assets falls within the matrix.

My placement of the equities within the matrix offers a good example. I generally have the equities in the lower right quadrant (strong decline/bear market). This despite SPY MACD momentum having moved into the MACD advancing quadrant. I have left it in the bear market quadrant because, A) Price is still significantly below last years high. B) The equal weight SPY and NYSE composite have not displayed similar strength. C) My read of macro conditions is still bearish (this is where behavioral bias can really make a difference in where the assets are placed). Point being, the work is a combination of quantitative and qualitative and clearly has a subjective aspect.

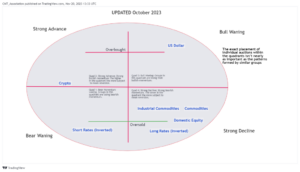
After placing the individual assets in the matrix I then distill them into 7 categories and place them into the position in the matrix that best describes that group. Remember that individual auctions, sectors, etc. may be in far different positions than the bulk of the category but the distillation is a weight of the evidence process meant to identify the approximate position of the bulk of similar auctions. More detailed distillations can separate industrial and agricultural commodities, and add bond market credit spreads, hyper cyclical and financial companies.
For comparison, I have included the distilled matrix from 2022:

In the next installment we will describe how the sectors interact over the course of a typical business cycle, plot the information onto a stylized business cycle and draw conclusions about the current cycle.
And finally, many of the topics and techniques discussed in this post are part of the CMT Associations Chartered Market Technician’s curriculum.
—
Originally Posted November 21, 2023 – Visualizing Business and Market Cycles Through Market Momentum 2
Disclosure: CMT Association
Shared content and posted charts are intended to be used for informational and educational purposes only. The CMT Association does not offer, and this information shall not be understood or construed as, financial advice or investment recommendations. The information provided is not a substitute for advice from an investment professional. The CMT Association does not accept liability for any financial loss or damage our audience may incur.
Disclosure: Interactive Brokers
Information posted on IBKR Campus that is provided by third-parties does NOT constitute a recommendation that you should contract for the services of that third party. Third-party participants who contribute to IBKR Campus are independent of Interactive Brokers and Interactive Brokers does not make any representations or warranties concerning the services offered, their past or future performance, or the accuracy of the information provided by the third party. Past performance is no guarantee of future results.
This material is from CMT Association and is being posted with its permission. The views expressed in this material are solely those of the author and/or CMT Association and Interactive Brokers is not endorsing or recommending any investment or trading discussed in the material. This material is not and should not be construed as an offer to buy or sell any security. It should not be construed as research or investment advice or a recommendation to buy, sell or hold any security or commodity. This material does not and is not intended to take into account the particular financial conditions, investment objectives or requirements of individual customers. Before acting on this material, you should consider whether it is suitable for your particular circumstances and, as necessary, seek professional advice.
Disclosure: Futures Trading
Futures are not suitable for all investors. The amount you may lose may be greater than your initial investment. Before trading futures, please read the CFTC Risk Disclosure. A copy and additional information are available at ibkr.com.
Disclosure: Forex
There is a substantial risk of loss in foreign exchange trading. The settlement date of foreign exchange trades can vary due to time zone differences and bank holidays. When trading across foreign exchange markets, this may necessitate borrowing funds to settle foreign exchange trades. The interest rate on borrowed funds must be considered when computing the cost of trades across multiple markets.
Disclosure: ETFs
Any discussion or mention of an ETF is not to be construed as recommendation, promotion or solicitation. All investors should review and consider associated investment risks, charges and expenses of the investment company or fund prior to investing. Before acting on this material, you should consider whether it is suitable for your particular circumstances and, as necessary, seek professional advice.


Join The Conversation
If you have a general question, it may already be covered in our FAQs. If you have an account-specific question or concern, please reach out to Client Services.