


Excerpt
What is Exploratory Data Analysis?
It is said that John Tukey was the one who introduced and made Exploratory data analysis a crucial step in the data science process. When asked what does it mean, he simply said, “Exploratory data analysis” is an attitude, a state of flexibility, a willingness to look for those things that we believe are not there, as well as those we believe to be there.
The main aim of exploratory data analysis is to:
- Gain insight into the available data
- Find out any relation between the different variables
- Find anything which is out of the ordinary, ie outlier or anomaly
- Test any assumptions or instincts
- Find any optimum parameters or variable which will help us solve the problem statement faster
Yes, that’s probably it. You can see where the EDA process stands in the whole data science process below

The main component in exploratory data analysis is the visualisation of data. Let’s see how we perform Exploratory Data Analysis in the next section.
What are the types of EDA methods?
Existing literature tells us that there are four types of exploratory data analysis. Let’s look at them below:
Univariate non-graphical method
Breaking down the name, univariate implies that there is just one variable and non-graphical is well, there is no visual element in this method.
There are plenty of examples in this method, which can vary from the height of NBA players in a team or only the opening price of Tesla Inc. in 2019. One of the Univariate non-graphical methods can be the 5 number summary of a variable.
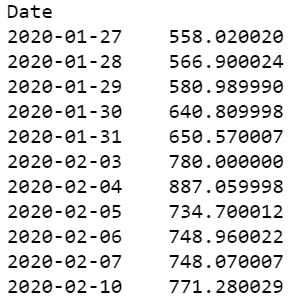
Taking the example of Tesla Closing prices for 11 days, we will take only the closing prices and tabulate them below. Thus it would look something like this:
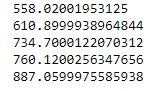
The five-number summary consists of the Minimum value, 1st Quartile, Median, 3rd Quartile, and Maximum number.
Let’s calculate this in Python:
# import 11 day Tesla data
 import yfinance as yf
 tesla = yf.download('TSLA','2020-01-27', '2020-02-11')
 tesla['Close']

 # Calculating the 5 number summary
 from numpy import percentile

 # calculate quartiles
All_quartiles = percentile(tesla['Close'], [25, 50, 75])

 # calculate min/max
 Minimum, Maximum = tesla['Close'].min(), tesla['Close'].max()

 # print the five number summary
 print(Minimum)
 print(All_quartiles[0])
 print(All_quartiles[1])
 print(All_quartiles[2])
 print(Maximum)
You will get the following output:
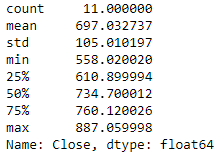
Of course, apart from the following, you can always check the number of values, the mean etc.
By the way, you can also try the one-line command which pretty much gives you all the information you need in a simple format.
The Python code is:
tesla['Close'].describe()
Visit QuantInsti website to read the full article and download the Python code:
https://blog.quantinsti.com/exploratory-data-analysis-python/
Disclaimer: All investments and trading in the stock market involve risk. Any decisions to place trades in the financial markets, including trading in stock or options or other financial instruments is a personal decision that should only be made after thorough research, including a personal risk and financial assessment and the engagement of professional assistance to the extent you believe necessary. The trading strategies or related information mentioned in this article is for informational purposes only.
Disclosure: Interactive Brokers
Information posted on IBKR Campus that is provided by third-parties does NOT constitute a recommendation that you should contract for the services of that third party. Third-party participants who contribute to IBKR Campus are independent of Interactive Brokers and Interactive Brokers does not make any representations or warranties concerning the services offered, their past or future performance, or the accuracy of the information provided by the third party. Past performance is no guarantee of future results.
This material is from QuantInsti and is being posted with its permission. The views expressed in this material are solely those of the author and/or QuantInsti and Interactive Brokers is not endorsing or recommending any investment or trading discussed in the material. This material is not and should not be construed as an offer to buy or sell any security. It should not be construed as research or investment advice or a recommendation to buy, sell or hold any security or commodity. This material does not and is not intended to take into account the particular financial conditions, investment objectives or requirements of individual customers. Before acting on this material, you should consider whether it is suitable for your particular circumstances and, as necessary, seek professional advice.